DataOps vs DevOps: An Overview of the Twins of Digital Transformation

data ops vs dev ops

If you’re comparing DataOps vs DevOps for a practical digital transformation approach, you’re engaging in the wrong debate. Sure DevOps has revolutionized how companies deliver software. But, DataOps is transforming how companies utilize data. So instead, the better question should be: How can I use both DevOps and DataOps to enhance the value I deliver to my customers?

Regardless of the size of your enterprise or the industry you operate in, a good understanding of DevOps and DataOps principles, differences, use cases, and how they fit together is instrumental to accelerating product development and improving your technology processes.

What is DevOps?

Development Operations (or DevOps) combines principles, technologies, and processes that improve and accelerate an organization’s capacity to produce high-quality software applications, allowing it to evolve and improve products faster than traditional software development methods.

How DevOps Fits Into The Technology Stack

Fundamentally, DevOps is about improving the tools and processes around delivering software. In the traditional software development model, the development and operations teams are separate. The development team focuses on designing and writing software. The operations team handles other processes not directly related to writing code, such as software deployments, server provisioning, and operational support. However, the disadvantages to this approach are that the development team has to depend on the operations team to ship out new features, which leads to slower deployments.

Additionally, when bug fixes and problems arise, the operations team has to depend on the development team to resolve them; this leads to a longer time to detect and resolve issues and ultimately affects software quality. Consequently, the DevOps model came as a solution to these pain points.

In a DevOps model, the development and operations teams no longer work in isolation. Often, these two teams combine into a single unit where the software engineers work on the entire application cycle, from development and testing to deployment and operations, to deliver the software faster and more efficiently. Larger companies often have specialized “DevOps engineers” whose primary purpose is to build, test, and maintain the infrastructure and tools that empower software developers to release high-quality software quickly. 

What is DataOps?

Data Operations (or DataOps) is a data management strategy that focuses on improving collaboration, automation, and integration between data managers and consumers to enable quick, automated, and secure data flows (acquisition, transformation, and storage) across an organization. Its purpose is to deliver value from data faster by enabling proper data management and bringing together those who require data and those who operate it, removing friction from the data lifecycle.

How DataOps Fits Into The Technology Stack

The primary purpose of DataOps is to deliver value from data faster by streamlining and optimizing the management and delivery of data, thereby breaking down the traditional barriers that prevent people from accessing the data they need. 

According to a recent study by VentureBeat, lack of data access is one of the reasons why 87% of data science projects never make it to production. For instance, data consumers like data scientists and analysts responsible for utilizing data to generate insights depend on data operators such as database administrators and data engineers to provide data access and infrastructure. For example, take a data scientist who has to rely on a data engineer to clean and validate the data and set up the required environment to run the ML(machine learning) models. In this case, the faster the data scientists get their requirements met, the quicker they can start delivering value on projects.

Additionally, a data scientist who doesn’t understand how the data engineer collected and prepared their data will waste time making inferences out of the noise. Similarly, a data engineer who doesn’t understand the use cases of their data will create unusable data schemas and miss crucial data quality issues. Consequently, the DataOps process came to mitigate these data pain points.

DataOps takes this cluttered mess and turns it into a smooth process where data teams aren’t spending their time trying to fix problems. Instead, they can focus on what matters: providing actionable insights. DataOps relies heavily on the automation capabilities of DevOps to overcome data friction. For example, suppose the processes such as server provisioning and data cleaning are automated. A data scientist can easily access the data they need to run their models, and analysts can run reports in minutes and not days. Larger companies often have specialized “DataOps engineer” roles whose purpose is to automate data infrastructure needs and build, create and deploy tools that help data consumers utilize data quickly to deliver value to the enterprise.

DataOps and DevOps: Overlapping Principles

DevOps and DataOps share some underlying principles. They require a cultural shift from isolation to collaboration. They both depend heavily on tools and technologies for process automation, and they both employ agile methodologies that support incremental delivery. As such, both DevOps and DataOps represent a sweeping change to the core areas of culture, process, and technology.

  • Culture: DevOps and DataOps require a change in culture and mindset, focused on collaboration and delivering value instead of isolation and performing functions. In both cases, every team works together towards a common goal – delivering value. DevOps is about removing the barriers that prevent software from being deployed fast. For DataOps, it is breaking down obstacles that prevent people from managing and accessing data quickly. 
  • Process: DevOps and DataOps require an end-to-end revision of traditional methods focusing on automation and continuous improvement. Both DevOps and DataOps leverage continuous integration and delivery(CI/CD) in their processes. In the case of DevOps, the software is merged into a central repository, tested, built, and deployed to various environments(test and production). In the case of DataOps, CICD involves setting up workflows that automate various data processes such as uploading, cleaning, and validating data from source to destination.
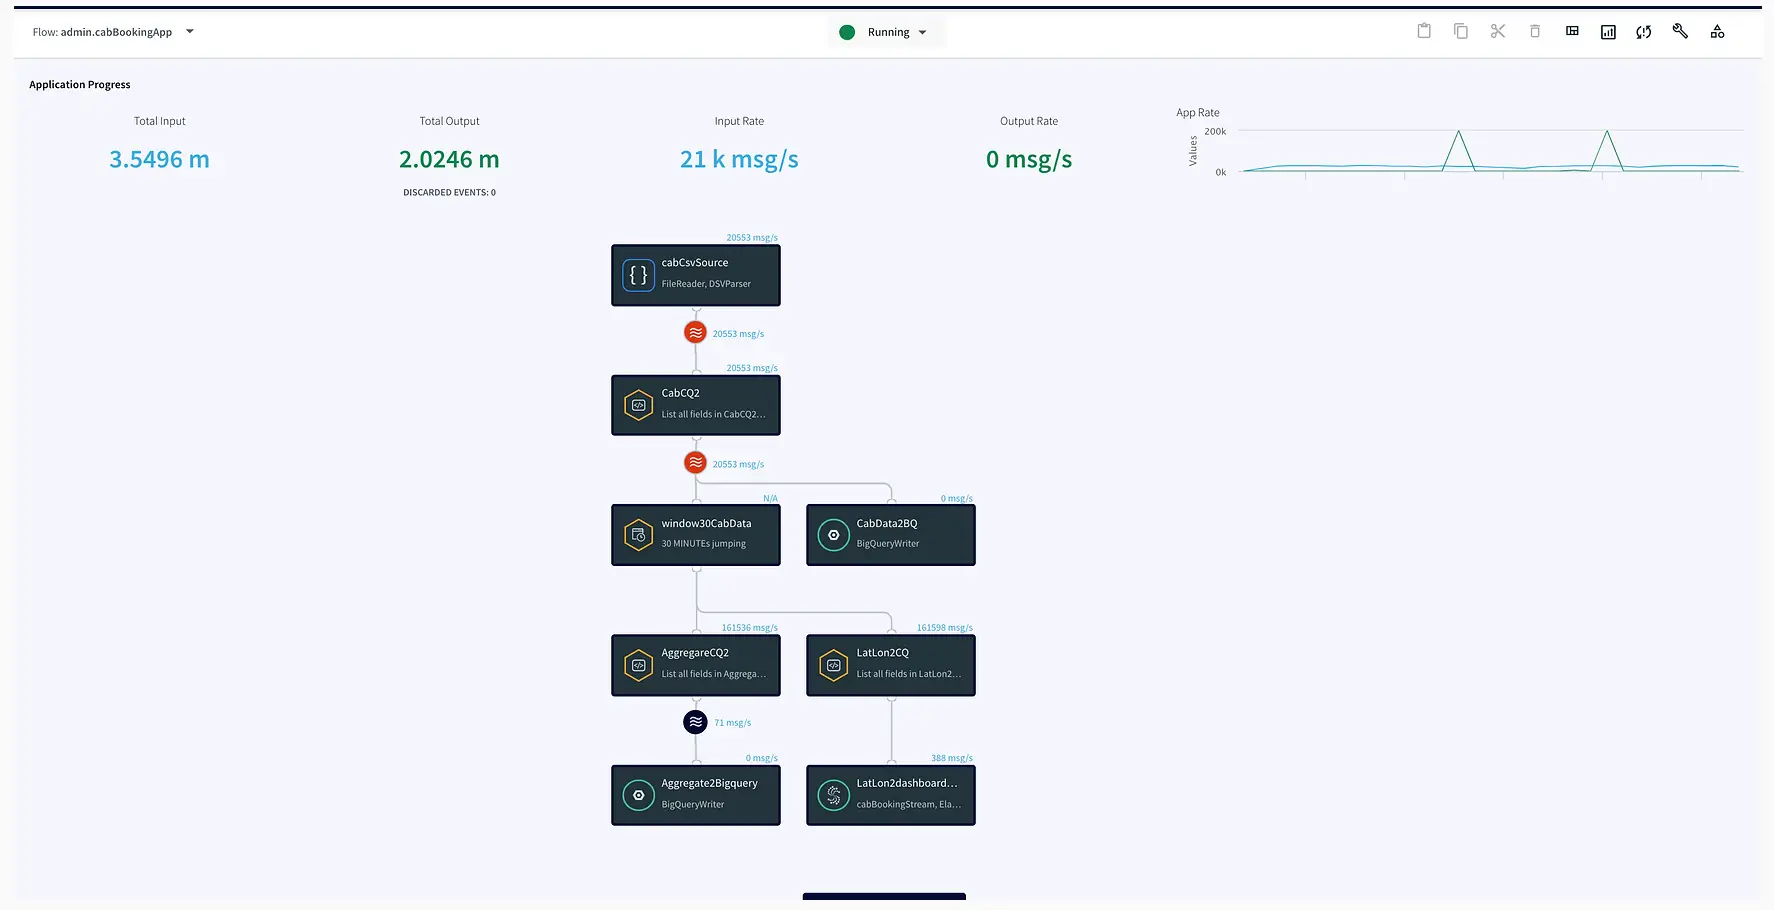
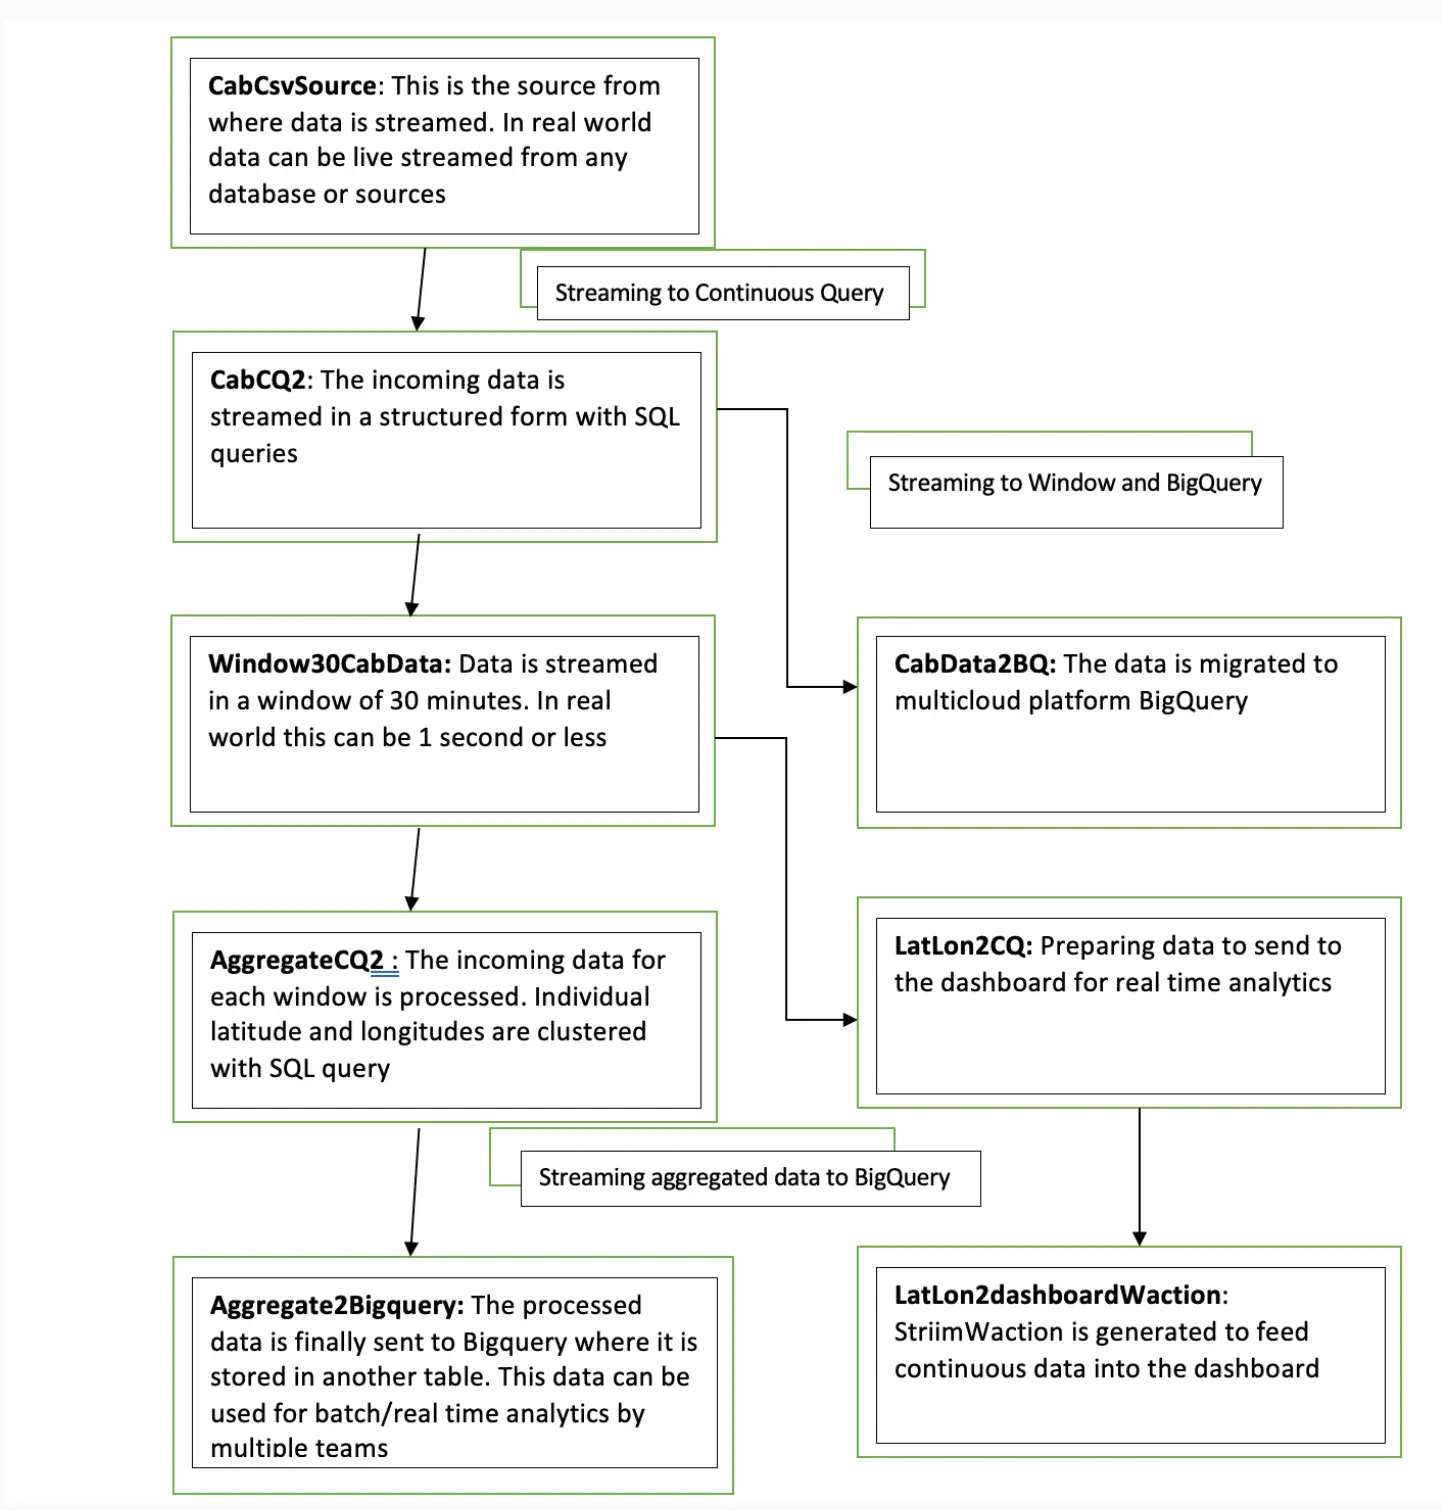
  • Technology. DevOps and DataOps rely heavily on tools to provide complete automation for different workflows(development, testing, deployment, monitoring). For DevOps, tools such as Jenkins and Ansible help automate the entire application lifecycle from development to deployment. In the case of DataOps, platforms like Apache Airflow and DataKitchen help organizations control their data pipelines from data orchestration to deployment. Additionally, data integration tools like Striim automate data integration from multiple sources, helping organizations quickly access their data.

DataOps vs DevOps: Differences and Use Cases

Although DevOps and DataOps have similarities, one mistake companies make when comparing them is thinking they are the same thing. They tend to take everything they have learned about DevOps, apply it to “data,” and present it as DataOps; this misconception can add needless complexity and confusion and fails to reap the benefits of DataOps processes. Some differences between DevOps and DataOps are:

  • DevOps focuses on optimizing the software delivery; DataOps focuses on optimizing data management and access.
  • DevOps involves primarily technical people- software engineers, testers, IT operations team. In contrast, the participants in DataOps are a mix of technical(data engineers, data scientists) and non-technical people (business users and other stakeholders).
  • DevOps requires somewhat limited coordination once set up. However, because of the ever-changing nature of data, its use cases (and everyone who works with it). DataOps requires the consistent coordination of data workflows across the entire organization.

While foundationally, the concepts of DevOps serve as a starting point for DataOps, the latter involves additional considerations to maximize efficiency when operating data and analytical products. 

Each approach has its unique strengths, making it the best choice for different scenarios.

Top DevOps Use Cases

  • Faster development of quality software: One of the top use cases of DevOps is in shipping software products faster. Google’s 2021 State of DevOps report stated that DevOps teams now deploy software updates 973x more frequently than traditional development teams. Additionally, Netflix reported faster and more quality software deployments after switching to DevOps. They implemented a model where all software developers are “Full cycle developersand responsible for the entire application lifecycle. The result was a boost in the speed of software deployments from days to hours.
  • Improved Developer Productivity: Organizations that have implemented DevOps have seen an increase in the productivity of their development teams. By automating the underlying infrastructure to build, test and deploy applications, developers can focus on what matters – building quality solutions. By implementing DevOps practices, Spotify boosted its developer productivity by 99%. Time to develop and deploy websites and backend services went from 14 days to 5 minutes.

Top DataOps Use Cases

  • Accelerates Machine Learning and Data Analytics Workloads: The main goal of DataOps is to remove barriers that prevent people from accessing data. A recent survey by McKinsey reported that organizations spend 80 percent of their analytics time on repetitive tasks such as preparing data. When such repetitive tasks are automated, data consumers like data scientists and data analysts can access data faster to perform machine learning and data analytics workloads. In a recent case study by Data Kitchen, pharmaceutical company Celgene saw improvements in the development and deployment of analytics processes and the quality of the insights after implementing DataOps. Visualizations that took weeks/months were now taking less than a day.
  • Improved Data Quality: Ensuring data quality is of utmost importance to any enterprise. In a study by Gartner, organizations surveyed reported that they lose close to $15 million per annum due to poor data quality. By implementing DataOps practices, companies can improve the quality of data that flows through the organization and save costs. In 2019, Airbnb embarked on a data quality initiative to rebuild the processes and technologies of their data pipelines. They automated the data validation and anomaly detection by leveraging tools that enabled extensive data quality and accuracy in their data pipelines. 
  • Maintain Data Freshness Service Level Agreements: Data has entered a new stage of maturity where data teams must adhere to strict Service Level Agreements (SLAs). Data must be fresh, accurate, traceable, and scalable with maximum uptime so businesses can react in real time to business events and ensure superior customer experiences. By incorporating DataOps practices, companies can ensure that data is dispersed across business systems with minimal latency. For example, Macy’s uses Striim to meet the demands of online buyers by replicating inventory data with sub-second latency, allowing them to scale for peak holiday shopping workloads.

Use Both DevOps and DataOps For The Best Of Both Worlds

Both DevOps and DataOps teams depend on each other to deliver value. Therefore, companies get the best success by incorporating DevOps and DataOps in their technology stack. The result of having both DevOps and DataOps teams working together is accelerated software delivery, improved data management and access, and enhanced value for the organization.

As you begin your digital transformation journey, choose Striim. Striim makes it easy to continuously ingest and manage all your data from different sources in real-time for data warehousing. Sign up for your free trial today!

A Brief Overview of the Data Lakehouse

Both data warehouses and data lakes have been serving companies well for a long time. Despite their pros, each also has its limitations. That’s why data architects envision a single system to store and use data for varying workloads. This is where a data lakehouse has emerged as a major problem-solver in the last few years.

A data lakehouse can help organizations move past the limitations of data warehouses and data lakes. It lets them reach a middle ground where they can get the best of both worlds in terms of data storage and data management.

What is a data lakehouse?

A data lakehouse shores up the gaps left by data warehouses and data lakes — two commonly used data architectures. To understand how a data lakehouse works, let’s first take a brief look at data warehouses and data lakes.

Defining data warehouses

A data warehouse collects data from various data sources within an organization to extract information for analysis and reporting. Usually, data warehouses pull data from databases, which have a specific structure known as schema. This data gets processed into a different database format that’s optimized for BI (business intelligence) use cases, where it’s more effective for complex queries.

This data warehouse process has its advantages. It prioritizes certain factors, such as the integrity of the provided data. However, this approach comes with several drawbacks, including the higher costs due to maintenance and vendor lock-in, necessitating the need for more cost-effective data management approaches. 

Defining data lakes

The data lake was invented in 2010 and rapidly gained mainstream adoption throughout the 2010s. Unlike a data warehouse, a data lake is more adept at processing unstructured data, so it can be used for data analytics. This is the data companies can gather from web scraping, web APIs, or files that don’t follow the structure of a relational database.

In addition, data lakes store data at a more affordable rate. That’s because data lake is installed on low-cost hardware and uses open-source software. But data lakes don’t offer all the features offered by a data warehouse. Consequently, contrary to a data warehouse, the data might be lacking in terms of integrity, quality, and consistency.

Combining the advantages of both into a data lakehouse

A data lakehouse offers the best of both worlds by combining the best aspects of data warehouses and data lakes. Similar to a data warehouse, it offers schema support for structured data and keeps data consistent by supporting ACID transactions.

And like data lakes, a data lakehouse can handle unstructured, semi-structured, and structured data. This data can be stored, transformed, and analyzed for text, audio, video, and images. Finally, data lakehouses offer a more affordable method of storing large volumes of data because they utilize the low-cost object storage options of data lakes to cut costs.

What problems can a data lakehouse solve?

Many organizations use data warehouses and data lakes with plenty of success. However, certain problems show up in certain cases.

  • Data duplication: If a company uses many data warehouses and a data lake, then it’s bound to create data redundancy — when the same piece of data is stored in two or more separate places. Not only is it inefficient, but it may also cause data inconsistency (when the same data is stored in different versions in more than one table). A data lakehouse can help consolidate everything, remove additional copies of data, and create a single version of truth for the company.
  • Siloes between analytics and BI: Data scientists use analytics techniques on data lakes to go through unsorted data, while BI analysts use a data warehouse. A data lakehouse helps both teams to work within a single and shared repository. This aids in reducing data silos.
  • Data staleness: According to a survey by Exasol, 58% of companies make decisions based on outdated data. Data warehouses are part of the problem because it is generally expensive to constantly process and refresh real-time data. A data lakehouse supports reliable and convenient integration of real-time streaming along with micro-batches. This makes sure that analysts can always use the latest data.

The common features of a data lakehouse

A data lakehouse aims to improve efficiency by building a data warehouse on data lake technology. According to a paper from Databricks, a data lakehouse does this by providing the following features:

  • Extended data types: Data lakehouses have access to a broader range of data than data warehouses, allowing them to access system logs, audio, video, and files.
  • Data streaming: Data lakehouses allow enterprises to perform real-time reporting by supporting streaming analytics. Especially when used with streaming data integration products like Striim in concert. 
  • Schemas: Unlike data lakes, data lakehouses apply schemas to data, which helps in the standardization of high volumes of data.
  • BI and analytics support: BI and analytics professionals can share the same data repository. Since a data lakehouse’s data goes through cleaning and integration, it’s useful for analytics. Also, it can store more updated data than a data warehouse. This enhances BI quality.
  • Transaction support: Data lakehouses can handle concurrent write and read transactions and thus can work with several data pipelines.
  • Openness: Data lakehouses support open storage formats (e.g., Parquet). This way, data professionals can use R and Python to access it easily.
  • Processing/storage decoupling: Data lakehouses reduce storage costs by using clusters that run on cheap hardware. A lakehouse can offer data storage in one cluster and query execution on a separate cluster. This decoupling of processing and storage can help to make the most of resources.

Layers in a data lakehouse

Based on Amazon and Databricks data lakehouse architectures, a data lakehouse can have five layers, as shown below:

data lakehouse architecture


1- Ingestion layer

The first layer pulls data from multiple data sources and delivers it to the storage layer. The layer uses different protocols to link to a variety of external and internal sources, such as CRM applications, relational databases, and NoSQL databases.

2- Storage layer

The storage layer stores open-source file formats to store unstructured, semi-structured, and structured data. A lakehouse is designed to accept all types of data as objects in affordable object stores (e.g., AWS S3).

You can use open file formats to read these objects via the client tools. As a result, consumption layer components and different APIs can access and work with the same data.

3- Metadata layer

The metadata layer is a unified catalog that encompasses metadata for data lake objects. This layer provides the data warehouse features that are accessible in relational database management systems (RDBMS). For instance, you can create tables, implement upserts, and define features that enhance RDBMS performance.

4- API Layer

This layer is used to host different APIs to allow end-users to process tasks quickly and take advantage of advanced analytics. This layer produces a level of abstraction that enables consumers and developers to get the benefit from using a plethora of languages and libraries. These APIs and libraries are optimized to consume your data assets in your data lake layer (e.g., DataFrames APIs in Apache Spark).

5- Data consumption layer

This layer is used to host different tools and applications, such as Tableau. Client applications can use the data lakehouse architecture to access data stores in the data lake. Employees within a company can use the data lakehouse to perform different analytics activities, such as SQL queries, BI dashboards, and data visualization.

Leverage a data lakehouse for the right use cases

A data lakehouse isn’t a silver bullet that’ll address all your data-related challenges. It can be tricky to build and maintain a data lakehouse due to its monolithic architecture. In addition, its one-size-fits-all design might not always provide the same quality that you can get with other approaches that are designed to tackle more specific use cases. 

On the other hand, there are many scenarios where a data lakehouse can add value to your organization. Data lakehouses can help you to stage all your data in a single tier. You can then optimize this data for various types of queries on unstructured and structured data. For example, if you’re looking to use both AI and BI, then the versatility of a data lakehouse can be useful. You can also use a data lakehouse to address the data inconsistency and redundancy caused by multiple systems. For more details, go through this comparison and decide which data management solution is best for you. 

Real-Time Hotspot Detection For Transportation with Striim and BigQuery

Tutorial

Real-Time Hotspot Detection For Transportation with Striim and BigQuery

Detect and visualize cab booking hotspots using Striim and BigQuery

Benefits

Analyze Real-Time Operational DataStriim facilitates lightning speed data transfer that enables tracking of real-time booking data for strategic decisionsDetect Hotspots in Real TimeWith Striim’s live dashboard millions of data can be processed to capture booking updates at different geographical locationsPerform Real-time Analytics with Fast data replicationWith CDC technology live data from multiple sources can be replicated to the cloud for access across multiple teams for analytics
On this page

Overview

Transportation services like Uber and Lyft require streaming data with real-time processing for actionable insights on a minute-by-minute basis. While batch data can provide powerful insight on medium or long-term trends, in this age live data analytics is an essential component
of enterprise decision making. It is said data loses its importance within 30 minutes of generation. To facilitate better performance for companies that hugely depend on live data, Striim offers continuous data ingestion from multiple data sources in real-time. With Striim’s powerful log-based Change Data
Capture platform, database transactions can be captured and processed in real-time along with data migration to multiple clouds. This technology can be used by all e-commerce, food-delivery platforms, transportation services, and many others that harnesses real-time analytics to generate value. In this
blog, I have shown how real-time cab booking data can be streamed to Striim’s platform and processed in-flight for real-time visualization through Striim’s dashboard and simultaneous data migration to BigQuery at the same time.

Video Walkthrough

Core Striim Components

File Reader: Reads files from disk using a compatible parser.

Stream: A stream passes one component’s output to one or more other components. For example, a simple flow that only writes to a file might have this sequence

Continuous Query : Striim Continuous queries are are continually running SQL queries that act on real-time data and may be used to filter, aggregate, join, enrich, and transform events.

Window: A window bounds real-time data by time, event count or both. A window is required for an application to aggregate or perform calculations on data, populate the dashboard, or send alerts when conditions deviate from normal parameters.

WAction and WActionStore: A WActionStore stores event data from one or more sources based on criteria defined in one or more queries. These events may be related using common key fields.

BigQueryWriter: Striim’s BigQueryWriter writes the data from various supported sources into Google’s BigQuery data warehouse to support real time data warehousing and reporting.

Dashboard: A Striim dashboard gives you a visual representation of data read and written by a Striim application

Using Striim for CDC

Change Data Capture has gained popularity in the last decade as companies have realized the power of real-time data analysis from OLTP databases. In this example, data is acquired from a CSV file and streamed with a window of 30 minutes. Due to memory limitation, the window was
kept for 30 minutes for better visualization. Ideally, Striim can handle a window of even 1 second when the amount of data is huge. The data was also processed inside Striim and the change was captured and migrated to BigQuery data warehouse.

The dataset used in this example contains 4.5 million uber booking data that contains 5 features, DateTime, latitude, longitude, and TLC base company
at NYC. The goal is to stream the data through Striim’s CDC platform and detect the areas that have more bookings (hotspots) every 30 minutes. The latitude and longitude value was converted using the following query to cluster them into certain areas

The following steps were followed before deploying the app

Step 1: Reading Data from CSV and Streaming into Continuous Query through stream

In this step, the data is read from the data source using a delim-separated parser (cabCsvSource) with FileReader adapter used for CSV source. The data is then streamed into cabCSvSourceStream which reaches cabCQ for continuous query. The SQL query at CabCQ2 converts the
incoming data into required format

Step 2: Sending the data for processing in Striim as well as into BigQuery

The data returned from the continuous query is then sent for processing through a 30-minute window and also migrated to BigQuery for storage. This is a unique feature of the Striim platform that allows data migration and processing at the same time. The data transferred to
Bigquery can be used by various teams for analytics while Striim’s processing gives valuable insights through its dashboard.

The connection between Striim and BigQuery is set up through a service account that allows Striim application to access BigQuery. A table structure is created within BigQuery instance that replicates the schema of incoming stream of data.

Step 3: Aggregating Data using Continuous Query

After the data is captured, a query is applied on each window that clusters the latitudes and longitudes of pickup locations into discrete areas and returns the aggregate demand of each area in those 30 minutes. There is a slight difference between the clustering query that
goes into BigQuery(AggregateCQ) and the one that goes into StriimWaction(LatLonCQ). The data in StriimWaction is used for dashboard tracking hotspots, so the first latitude and longitude value is taken as the estimate of area. The data that goes into BigQuery returns all latitude longitude values and
could be used for further analytics.

Striim’s Dashboard for Real Time Analytics

The dashboard ingested data from two different streams. The window30CabData provided data to the bar chart that tracked the number of vehicles from each company every 30 mins and the vector map fetched data from LatLon2dashboardWaction that had the aggregated count of bookings
for every area in a 30-minute window. As seen from the dashboard snippet below, the dashboard was configured to return red for high demand (>30), yellow for medium demand (between 15-30), and green for low demand(less than 15). This can be very useful to companies for real-time tracking analytics
and
data migration. The dashboard has two components, a query where data is fetched from the app and processed as required. The other component is configuration, where specifications on visualization are entered. The SQL queries below show the query for the vector map and bar chart. The two snippets
from the
dashboard show an instant of booking at different locations and the number of vehicles from each TCL company.


Migrating Data to BigQuery

Finally, the aggregated data along with the source data was migrated to BigQuery. Migration to BigQuery followed the same process of creating a table schema that mirrored the structure of incoming data from Striim.

Flowchart

Below is the UI of cabBookingApp that tracks bookings within a given time window and returns aggregated demand in a Striim dashboard. The app also streams data from source to BigQuery .

Here is an overview of each component from the flowchart:

Setting Up the Tracking Application

Step 1: Download the data and Sample TQL file from our github repo

You can download the TQL files for streaming app and lag monitor app from our github repository. Deploy the Striim app on your Striim server.

Step 2: Configure your CSV source and BigQuery target and add it to the source and target components of the app

You can find the csv dataset in our github repo. Set up your BigQuery dataset and table that will act as a target for the streaming application

Step 3: Follow the recipe to create Striim Dashboard for real-time analytics

The recipe gives a detail on how to set up a Striim dashboard for this use case

Step 4: Run your app and dashboard

Deploy and run your app and dashboard for real-time tracking and analytics

Why Striim?

Striim is a single platform for real-time data ingestion, stream processing, pipeline monitoring, and real-time delivery with validation. It uses low-impact Change Data Capture technology to
migrate a wide variety of high-volume, high-velocity data from enterprise databases in real-time. Using Striim’s in-flight data processing and real-time dashboard, companies can generate maximum value from streaming data. Enterprises dealing with astronomical data can incorporate Striim to maximize profit with real-time strategic decisions. Striim is used by companies like Google, Macy’s, and Gartner for real-time data migration and analytics. In this data-driven age, generate maximum profit for your company using Striim’s CDC-powered platform.

To learn more about Striim for Google BigQuery, check out the related product page. Striim supports many different sources and targets. To see how Striim can help with your move to cloud-based services, schedule a demo with a Striim technologist or download a free trial of the platform.

Tools you need

Striim

Striim’s unified data integration and streaming platform connects clouds, data and applications.

Google BigQuery

BigQuery is a serverless, highly scalable multicloud data warehouse.

Data Observability: What Is It and Why Is It Important?

Data observabilityData has become one of the most valuable assets in modern times. As more companies rely on insights from data to drive critical business decisions, this data must be accurate, reliable, and of high quality. A study by Gartner predicts that only 20% of analytic insights will deliver business outcomes, with this other study citing poor data quality as the number one reason why the anticipated value of all business initiatives is never achieved.

Gaining insights from data is essential, but it is also crucial to understand the health of the data in your system to ensure the data is not missing, incorrectly added, or misused. That’s where data observability comes in. Data observability helps organizations manage, monitor, and detect problems in their data and data systems before they lead to “data downtimes,” i.e., periods when your data is incomplete or inaccurate.

What is Data Observability?

Data observability refers to a company’s ability to understand the state of its data and data systems completely. With good data observability, organizations get full visibility into their data pipelines. Data observability empowers teams to develop tools and processes to understand how data flows within the organization, identify data bottlenecks, and eventually prevent data downtimes and inconsistencies.

The Five Pillars of Data Observability

The pillars of data observability provide details that can accurately describe the state of the organization’s data at any given time. These five pillars make a data system observable to the highest degree when combined. According to Barr Moses – CEO of  Monte Carlo Data – there are the five pillars of data observability:

  1. Freshness: Ensuring the data in the data systems is up to date and in sync is one of the biggest issues modern organizations face, especially with multiple and complex data sources. Having data freshness in your data observability stack helps monitor your data system for data timeline inconsistencies and ensures your organization’s data remains up to date. 
  2. Distribution: Data accuracy is critical for building quality and reliable data systems. Distribution refers to the measure of variance in the system. If data wildly varies in the system, then there is an issue with the accuracy. The distribution pillar focuses on the quality of data produced and consumed by the data system. With distribution in your data observability stack, you can monitor your data values for inconsistencies and avoid erroneous data values being injected into your data system.
  3. Volume: Monitoring data volumes is essential to creating a healthy data system. Having the volume pillar in your data observability stack answers questions such as “Is my data intake meeting the estimated thresholds?” and “Is there enough data storage capacity to meet the data demands?” Keeping track of volume helps ensure data requirements are within defined limits.
  4. Schema: As the organization grows and new features are added to the application database, schema changes are inevitable. However, changes to the schema that aren’t well managed can introduce downtimes in your application. The schema pillar in the data observability stack ensures that database schema such as data tables, fields, columns, and names are accurate, up to date, and regularly audited.
  5. Lineage: Having a full picture of your data ecosystem is essential for managing and monitoring the pulse of your data system. Lineage refers to how easy it is to trace the flow of the data through our data systems. Data lineage answers questions such as “how many tables do we have?” “how are they connected?” “what external data sources are we connecting to?” Data lineage in your data observability stack combines the other four pillars into a unified view allowing you to create a blueprint of your data system.

Why Is Data Observability Important?

Data observability goes beyond monitoring and alerting; it allows organizations to understand their data systems fully and enables them to fix data problems in increasingly complex data scenarios or even prevent them in the first place.

Data observability enhances trust in data so businesses can confidently make data-driven decisions

Data insights and machine learning algorithms can be invaluable, but inaccurate and mismanaged data can have catastrophic consequences.

For example, in October 2020, Public Health England (PHE), which tallies daily new Covid-19 infections, discovered an Excel spreadsheet error that caused them to overlook 15,841 new cases between September 25 and October 2. The PHE reported that the error was caused by the Excel spreadsheet used to collect the data reaching its data limit. As a result, the number of daily new instances was far larger than initially reported, and tens of thousands of people who tested positive for Covid-19 were not contacted by the government’s “test and trace” program. 

Data observability helps monitor and track situations quickly and efficiently, enabling organizations to become more confident when making decisions based on data.

Data observability helps timely delivery of quality data for business workloads

Ensuring data is readily available and in the correct format is critical for every organization. Different departments in the organization depend on quality data to carry out business operations — data engineers, data scientists, and data analysts depend on data to deliver insights and analytics. Lack of accurate quality data could result in a breakdown in business processes that can be costly.

For example, let’s imagine your organization runs an ecommerce store with multiple sources of data (sales transactions, stock quantities, user analytics) that consolidate to a data warehouse. The sales department needs sales transactions data to generate financial reports. The marketing department depends on user analytics data to effectively conduct marketing campaigns. Data scientists depend on data to train and deploy machine learning models for the product recommendation engine. If one of the data sources is out of sync or incorrect, it could harm the different aspects of the business.

Data observability ensures the quality, reliability, and consistency of data in the data pipeline by giving organizations a 360-degree view of their data ecosystem, allowing them to drill down and resolve issues that can cause a breakdown in your data pipeline.

Data observability helps you discover and resolve data issues before they affect the business

One of the biggest flaws with pure monitoring systems is they only check for “metrics” or unusual conditions you anticipate or are already aware of. But what about cases you didn’t see coming?

In 2014, Amsterdam’s city council lost €188 million due to a housing benefits error. The software the council used to disburse housing benefits to low-income families was programmed in cents rather than euros, which inadvertently caused the error. The software error caused families to receive significantly more than they expected. People who would typically receive €155 ended up receiving €15,500. More alarming, in this case, is that nothing in the software alerted administrators of the error.

Data observability detects situations you aren’t aware of or wouldn’t think to look for and can prevent issues before they seriously affect the business. Data observability can track relationships to specific issues and provide context and relevant information for root cause analysis and remediation.

A new stage of maturity for data

Furthermore, the rise of Data Observability products like Monte Carlo Data demonstrate that data has entered a new stage of maturity where data teams must adhere to strict Service Level Agreements (SLAs) to meet the needs of their business. Data must be fresh, accurate, traceable, and scalable with maximum uptime so businesses can effectively operationalize the data. But how does the rest of the data stack live up to the challenge?

Deliver Fresh Data With Striim

Striim provides real-time data integration and data streaming, connecting sources and targets across hybrid and multi-cloud environments. With access to granular data integration metrics via a REST API, Striim customers can ensure data delivery SLAs in centralized monitoring and observability tools. 

To meet the demands of online buyers, Macy’s uses Striim to replicate inventory data with sub-second latency, scaling to peak holiday shopping workloads.

Furthermore, Striim’s automated data integration capabilities eliminates integration downtime by detecting schema changes on source databases and automatically replicating the changes to target systems or taking other actions (e.g. sending alerts to third party systems). 

automated schema change detection with Striim
Striim eliminates integration downtime with intelligent workflows that automatically respond to schema changes.

Learn more about Striim with a technical demo with one of our data integration experts or start your free trial here.

Back to top