The Future of AI is Real-Time Data

To the data scientists pushing the boundaries of what’s possible, the AI experts and enthusiasts who see beyond the horizon, and the techies building tomorrow’s solutions today — this manifesto is for you. The key to unlocking AI’s full potential lies in real time data. Traditional methods no longer suffice in a world that demands instant insights and immediate action.

Real-Time AI as the New Competitive Battleground

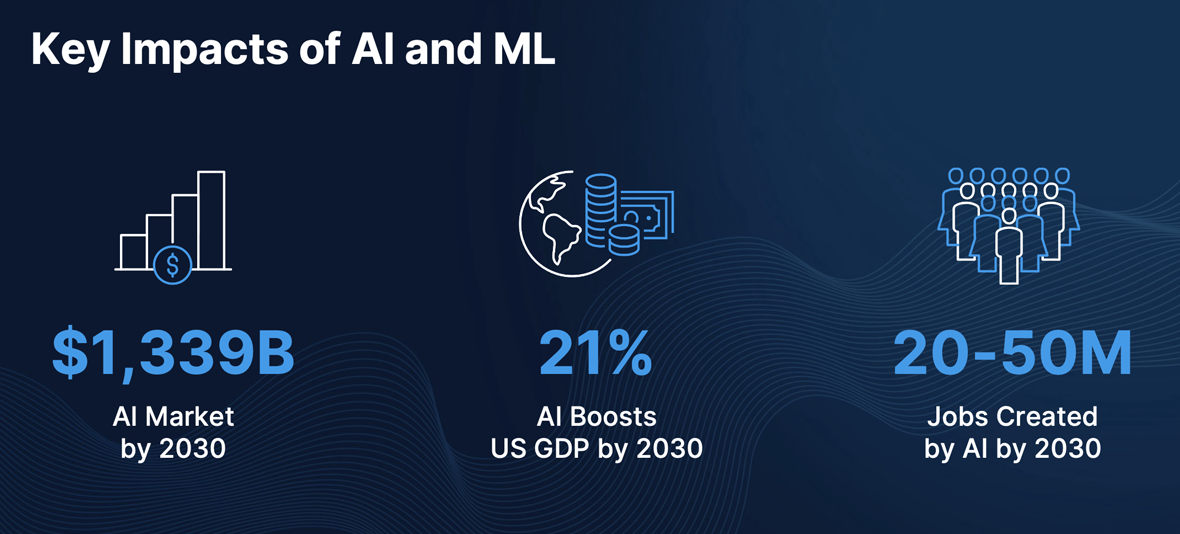
AI and ML are more than just buzzwords; they are driving substantial economic growth, creating new job opportunities, and shaping the future. The AI market is projected to reach a staggering $1,339 billion by 2030. This exponential growth underscores the widespread adoption and integration of AI across various industries. Furthermore, AI is on track to boost the US GDP by 21% by 2030. This highlights the profound economic impact AI will have. By automating routine tasks, optimizing operations, and providing deep insights through data analysis, AI enables businesses to increase productivity while reducing costs. And contrary to common fears that AI will eliminate jobs, it is expected to create 20-50 million positions by 2030. These roles will span various sectors, including data science, AI ethics, machine learning engineering, and AI-related research and development.

Real-Time Data — The Missing Link

What is Real-Time Data?

In the realm of data processing, real-time data refers to information that is delivered and processed almost instantaneously as it is generated. Unlike batch processing, which involves collecting and processing data in bulk at scheduled intervals, real-time data ensures immediate availability and actionability. This immediacy allows for decisions and responses to be made in the moment, offering a dynamic edge over traditional methods.

The Death of Traditional Batch Processing

The shift from batch processing to real-time data marks a crucial technological evolution driven by the need for speed and efficiency. Batch processing resulted in significant delays between data generation and actionable insights. As the demand for faster decision-making grew, the limitations of traditional batch processing became glaringly apparent. Traditional methods introduced latency, making it impossible to act on data immediately, a critical issue in environments requiring timely decisions.

Furthermore, batch processing systems were rigid and inflexible, struggling to scale as data volumes grew and needing substantial reengineering to adapt to new data types or sources. The advent of real-time data processing revolutionized this paradigm, providing the means to analyze and act on data as it flows, thereby minimizing latency to sub-second and offering unparalleled scalability and adaptability to modern data streams. This transformation is responsible for enabling real-time decision-making and fostering innovation across industries, cementing real-time data as the cornerstone of AI algorithms and advancements.

Dispelling Misconceptions and Demonstrating Value

In the world of AI and ML, there are a few common objections to the adoption of real-time data processing. Let’s dive into these misconceptions and demonstrate the true value of real-time capabilities.

Misconception: Batch Processing Suffices

Objection: Many AI/ML tasks can be handled with batch processing. Models trained on historical data can make predictions without needing real-time updates. The necessity of real-time data is highly specific to certain use cases, and not all industries or applications benefit equally.

Reality Check: While batch processing works for some tasks, it falls short in dynamic environments requiring high responsiveness and timely decision-making. Real-time data integration allows models to process the most recent data points, reducing lag between data generation and actionable insights. This is crucial in fields like finance, where market conditions shift rapidly, or e-commerce, where user behavior and inventory status constantly change. For example, fraud detection models relying on batch data might miss real-time anomalies, whereas real-time data can detect and respond to fraud within milliseconds. In healthcare, real-time patient monitoring can provide immediate insights for timely interventions, improving patient outcomes. The notion that real-time data is only useful in specific cases is outdated as countless industries increasingly leverage real-time capabilities to stay competitive and responsive.

Misconception: Complexity and Cost

Objection: Implementing real-time data systems is complex and costly. The infrastructure required for real-time data ingestion, processing, and analysis can be significantly more expensive than batch processing systems.

Reality Check: While real-time systems require an investment, the ROI is substantial. Modern cloud-based architectures and scalable platforms like Striim and Apache Kafka have reduced the complexity and cost of real-time data processing. Real-time systems drive higher revenues and better customer experiences by enabling immediate responses to emerging trends and anomalies. For instance, real-time inventory management in retail can prevent stockouts and overstock, directly impacting sales and customer satisfaction. The initial investment in real-time capabilities is outweighed by the long-term gains in efficiency, responsiveness, and competitive advantage.

Misconception: Data Quality and Stability

Objection: Real-time data can be noisy and unstable, leading to potential inaccuracies in model predictions. Batch processing allows for more thorough data cleaning and preprocessing.

Reality Check: Real-time data does not mean compromising on quality. Advanced real-time analytics platforms incorporate robust data cleaning and anomaly detection, ensuring models receive high-quality, stable inputs. Tools like Apache Beam and Spark Streaming provide mechanisms for real-time data validation and cleansing. Real-time data pipelines can also integrate seamlessly with existing ETL processes to maintain data integrity. By leveraging these technologies, organizations can ensure that their real-time data is as reliable and accurate as batch-processed data, while gaining the added advantage of immediacy.

Misconception: Model Retraining Frequency

Objection: Many models do not need to be retrained frequently. The insights gained from real-time data might not justify the cost and effort of constant retraining.

Reality Check: The pace of change in today’s world demands models that can adapt quickly. Real-time data enables continuous learning and incremental updates, ensuring models remain relevant and accurate. Techniques like online learning and incremental model updates allow models to evolve without the need for complete retraining. For example, recommendation systems can benefit from real-time user behavior data, continuously refining their suggestions to enhance user engagement. By integrating real-time data, organizations can maintain high model performance and accuracy, adapting swiftly to new patterns and trends.

Industry Disruption through Real-Time AI

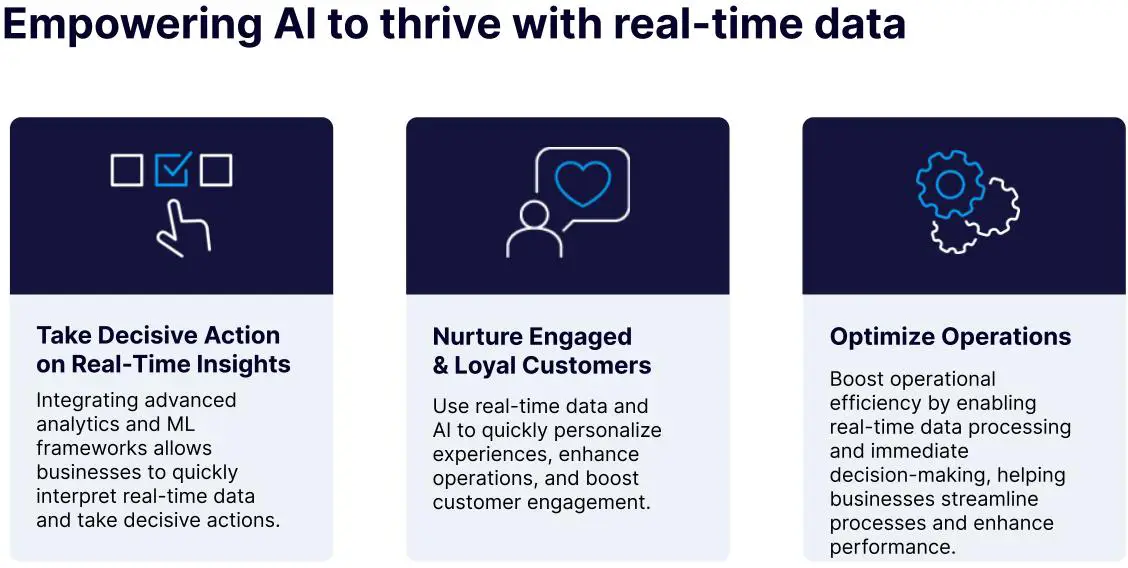
Real-time AI is redefining how businesses operate by providing up-to-the-second information that enhances predictive accuracy, supports continuous learning, and automates complex decision-making processes. This integration allows AI to adapt instantly to new data, which is essential for applications where split-second decision-making is critical, including fraud detection, autonomous vehicles, and financial trading. It also powers real-time anomaly detection in cybersecurity and manufacturing, identifying threats and malfunctions as they occur. Additionally, real-time data empowers personalized customer experiences by analyzing interactions on the fly, delivering tailored recommendations and services. The scalability and adaptability of real-time data platforms ensure AI systems are always equipped with the most current information, driving innovation and efficiency across industries.

Real-Time AI & ML in the Real World

Predictive Maintenance in Manufacturing

ML algorithms, often powered by sensors and IoT devices, continuously monitor equipment health. Anticipating failures, predictive maintenance minimizes downtime and optimizes productivity by analyzing historical data and real-time sensor readings, enabling proactive scheduling and preventing disruptions in production.

Customer Churn Prediction in Telecom

ML models may consider factors such as customer demographics, usage patterns, customer service interactions, and billing history. By identifying customers at risk of churn, telecom companies can implement targeted retention strategies, such as personalized offers or improved customer support.

Fraud Detection in Finance

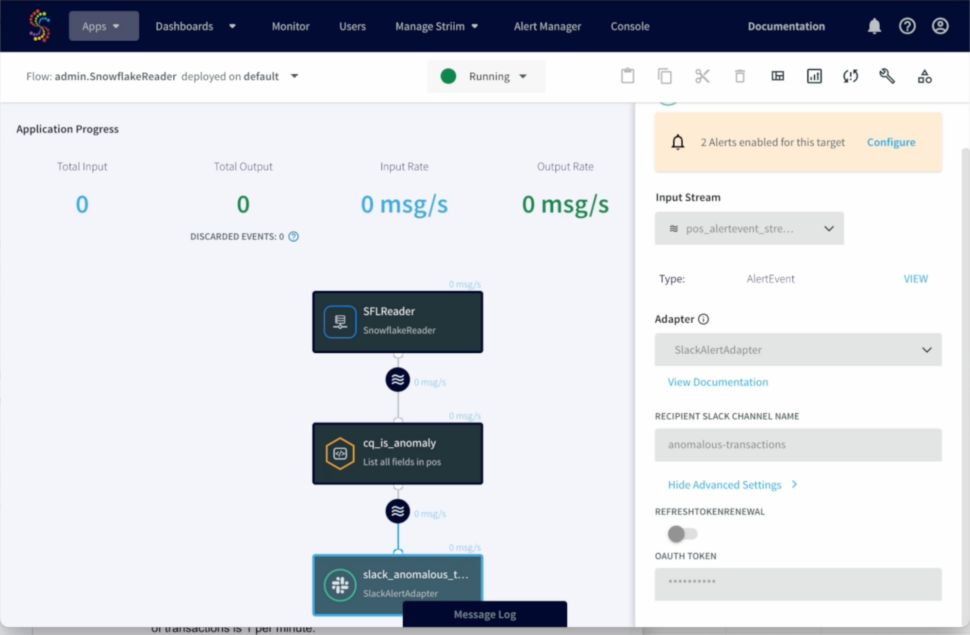
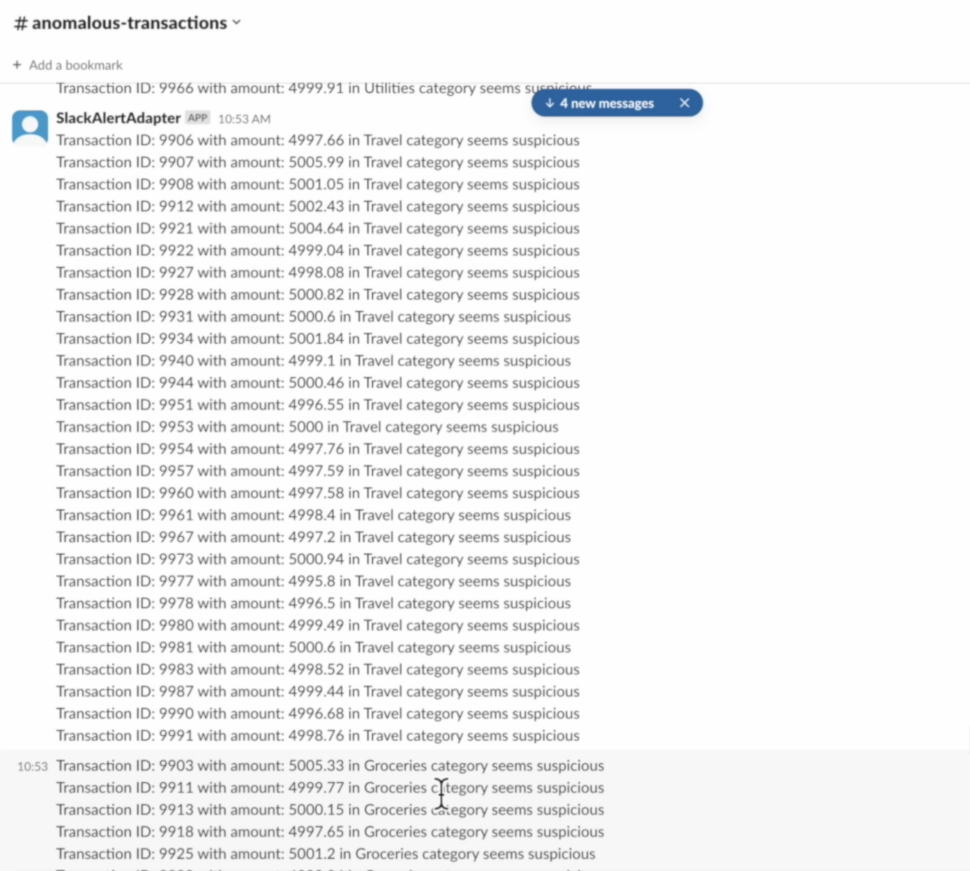
ML algorithms learn from historical data to identify patterns associated with fraudulent transactions. Real-time monitoring allows financial institutions to detect anomalies and trigger immediate alerts or interventions. This proactive approach helps prevent financial losses due to fraudulent activities.

Personalized Marketing in E-commerce

ML algorithms analyze not only purchase history but also browsing behavior and preferences. This enables e-commerce platforms to deliver personalized product recommendations through targeted advertisements, email campaigns, and website interfaces, enhancing the overall shopping experience.

Healthcare Diagnostics and Predictions

ML models, particularly in medical imaging, can assist healthcare providers by identifying subtle patterns indicative of diseases. Predictive analytics also help healthcare providers anticipate patient health deterioration, enabling early interventions and personalized treatment plans.

Dynamic Pricing in Retail

ML algorithms consider a multitude of factors, including competitor pricing, inventory levels, historical sales data, and customer behavior. By dynamically adjusting prices in real time, retailers can optimize revenue, respond to market changes, and maximize profitability.

Supply Chain Optimization

ML-driven demand forecasting considers historical data, seasonality, and external factors like economic trends and geopolitical events. This enables accurate inventory management, reduces excess stock, and ensures timely deliveries, ultimately improving the overall efficiency of the supply chain.

Human Resources and Talent Management

ML tools assist in resume screening by identifying relevant skills and qualifications. Predictive analytics can assess employee satisfaction, helping organizations identify areas for improvement and implement strategies to enhance employee retention and engagement.

UPS Success Story: Where Real-Time Data Supercharged Real-Time AI


Safeguarding shipments with AI and real-time data

UPS Capital® is leveraging Google’s Data Cloud and AI technologies to safeguard packages from porch piracy. With more than 300 million American consumers turning to online shopping, UPS Capital has witnessed the significant challenges customers face in securing their package delivery ecosystem. Now, the company is leveraging its digital capabilities and access to data to help customers rethink traditional approaches to combat shipping loss and deliver better customer experiences.

https://youtu.be/shreurvc28U?si=2rVZTIO0YWnMR2W-

DeliveryDefense™ Address Confidence utilizes real-time data and machine learning algorithms to safeguard packages. By assigning a confidence score to potential delivery locations, it enhances the assessment of successful delivery probabilities while mitigating loss or theft risks. Every address is allocated a confidence score on a scale from 100 to 1000, with 1000 indicating the highest probability of delivery success. These scores are based on customer reports of package theft. Shippers can integrate this score into their shipping workflow through an API to take proactive, preventative actions on low-confidence addresses. For instance, if a package is destined for an address with a low confidence score, the merchant can proactively reroute the shipment to a secure UPS Access Point location. These locations typically have a confidence score of around 950 due to their high chain of custody security precautions.

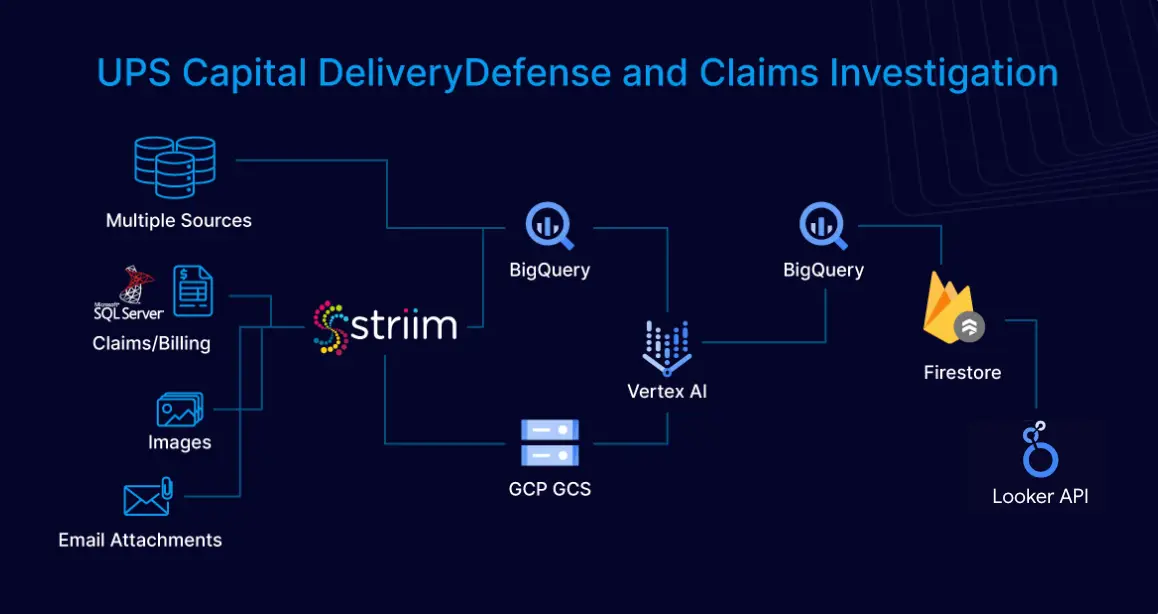
Striim’s real-time data integration platform works in tandem with Google Cloud’s modern architecture by dynamically embedding vectors into streaming information, enhancing data representation, processing efficiency, and analytical accuracy. Striim also integrates structured and unstructured data pulled from diverse sources and applies a variety of AI models from OpenAI and Vertex AI to generate embeddings that establish similarity scores between data points to reveal possible relationships.

UPS Capital brings significant operational rewards, evidenced by over 280,000 claims paid annually. With $236 billion in declared value and 690k shippers protected, its solutions offer robust protection for shippers, ensuring peace of mind and financial security in every shipment.

The Future of AI is Now — And It’s Real-Time

Real-time data and AI are significantly improving existing processes and impacting the bottom line across industries. From retail and finance to healthcare and beyond, the integration of real-time data is driving greater efficiency, more personalized customer experiences, and continuous innovation. This shift is creating new opportunities and setting higher standards.

Businesses are encouraged to embrace real-time data and AI to stay competitive in the future. By adopting these technologies, companies can fully leverage AI, stay ahead of the competition, and navigate the evolving technological landscape. The future of AI is real-time, and the time to act is now.

An In-Depth Guide to Real-Time Analytics

It’s increasingly necessary for businesses to make immediate decisions. More importantly, it’s crucial these decisions are backed up with data. That’s where real-time analytics can help. Whether you’re a SaaS company looking to release a new feature quickly, or own a retail shop trying to better manage inventory, these insights can empower businesses to assess and act on data quickly to make better decisions. As a result, you’ll enjoy empowered decision-making, know how to respond to the latest trends, and boost operational efficiency.

We’re here to walk you through everything you need to know about real-time analytics. Whether you want to learn more about the benefits of real-time analytics or dive deeper into the most significant characteristics of a real-time analytics system, we’ll ensure you have a robust understanding of how real-time analytics move your business forward. 

What is real-time analytics?

So, what is real time analytics? And more importantly, how does real-time analytics work? 

Real-time analytics refers to pulling data from different sources in real-time. Then, the data is analyzed and transformed into a format that’s digestible for target users, enabling them to draw conclusions or immediately garner insights once the data is entered into a company’s system. Users can access this data on a dashboard, report, or another medium.

Moreover, there are two forms of real-time analytics. These include: 

On-demand real-time analytics

With on-demand real-time analytics, users send a request, such as with an SQL query, to deliver the analytics outcome. It relies on fresh data, but queries are run on an as-needed basis. 

The requesting user varies, and can be a data analyst or another team member within the organization who wants to gain insight into business activity. For instance, a marketing manager can leverage on-demand real-time analytics to identify how users on social media react to an online advertisement in real time. 

Continuous real-time analytics

On the contrary, continuous real-time analytics takes a more proactive approach. It delivers analytics continuously in real time without requiring a user to make a request. You can view your data on a dashboard via charts or other visuals, so users can gain insight into what’s occurring down to the second.

One potential use case for continuous real-time analytics is within the cybersecurity industry. For instance, continuous real-time analytics can be leveraged to analyze streams of network security data flowing into an organization’s network. This makes threat detection a possibility. 

In addition to the main types of real-time analytics, streaming analytics also plays a crucial role in processing data as it flows in real-time. Let’s dive deeper into streaming analytics now. 

What’s the difference between real-time analytics and streaming analytics? 

Streaming analytics focuses on analyzing data in motion, unlike traditional analytics, which deals with data stored in databases or data warehouses. Streams of data are continuously queried with Streaming SQL, enabling correlation, anomaly detection, complex event processing, artificial intelligence/machine learning, and live visualization. Because of this, streaming analytics is especially impactful for fraud detection, log analysis, and sensor data processing use cases.

How does real-time analytics work?

To fully understand the impact of real-time analytics processing, it’s necessary to understand how it works. 

1. Collect data in real time

Every organization can leverage valuable real-time data. What exactly that looks like varies depending on your industry, but some examples include:

  • Enterprise resource management (ERP) data: Analytical or transactional data
  • Website application data: Top source for traffic, bounce rate, or number of daily visitors
  • Customer relationship management (CRM) data: General interest, number of purchases, or customer’s personal details
  • Support system data: Customer’s ticket type or satisfaction level

Consider your business operations to decide the type of data that’s most impactful for your business. You’ll also need to have an efficient way of collecting it. For instance, say you work in a manufacturing plant and are looking to use real-time analytics to find faults in your machinery. You can use machine sensors to collect data and analyze it in real time to deduct if there are any signs of failure.

For collection of data, it’s imperative you have a real-time ingestion tool that can reliably collect data from your sources. 

2. Combine data from various sources

Typically, you’ll need data from multiple sources to gain a complete analysis. If you’re looking to analyze customer data, for instance, you’ll need to get it from operational systems of sales, marketing, and customer support. Only with all of those facets can you leverage the information you have to determine how to improve customer experience. 

To achieve this, combine data from the sum of your sources. For this purpose, you can use ETL (extract, transform, and load) tools or build a custom data pipeline of your own and send the aggregated data to a target system, such as a data warehouse. 

3. Extract insights by analyzing data

Finally, your team will extract actionable insights. To do this, use statistical methods and data visualizations to analyze data by identifying underlying patterns or correlations in the data. For example, you can use clustering to divide the data points into different groups based on their features and common properties. You can also use a model to make predictions based on the available data, making it easier for users to understand these insights.

Now that you have an answer to the question, “how does real time analytics work?” Let’s discuss the difference between batch and real-time processing. 

Batch processing vs. real-time processing: What’s the difference? 

Real-time analytics is made possible by the way the data is processed. To understand this, it’s important to know the difference between batch and real-time processing.

Batch Processing

In data analytics, batch processing involves first storing large amounts of data for a period and then analyzing it as needed. This method is ideal when analyzing large aggregates or when waiting for results over hours or days is acceptable. For example, a payroll system processes salary data at the end of the month using batch processing.

“Sometimes there’s so much data that old batch processing (late at night once a day or once a week) just doesn’t have time to move all data and hence the only way to do it is trickle feed data via CDC,” says Dmitriy Rudakov, Director of Solution Architecture at Striim

Real-time Processing

With real-time processing, data is analyzed immediately as it enters the system. Real-time analytics is crucial for scenarios where quick insights are needed. Examples include flight control systems and ATM machines, where events must be generated, processed, and analyzed swiftly.

“Real-time analytics gives businesses an immediate understanding of their operations, customer behavior, and market conditions, allowing them to avoid the delays that come with traditional reporting,” says Simson Chow, Sr. Cloud Solutions Architect at Striim. “This access to information is necessary because it enables businesses to react effectively and quickly, which improves their ability to take advantage of opportunities and address problems as they arise.” 

Real-Time Analytics Architecture

When implementing real-time analytics, you’ll need a different architecture and approach than you would with traditional batch-based data analytics. The streaming and processing of large volumes of data will also require a unique set of technologies.

With real-time analytics, raw source data rarely is what you want to be delivered to your target systems. More often than not, you need a data pipeline that begins with data integration and then enables you to do several things to the data in-flight before delivery to the target. This approach ensures that the data is cleaned, enriched, and formatted according to your needs, enhancing its quality and usability for more accurate and actionable insights.

Data integration

The data integration layer is the backbone of any analytics architecture, as downstream reporting and analytics systems rely on consistent and accessible data. Because of this, it provides capabilities for continuously ingesting data of varying formats and velocity from either external sources or existing cloud storage.

It’s crucial that the integration channel can handle large volumes of data from a variety of sources with minimal impact on source systems and sub-second latency. This layer leverages data integration platforms like Striim to connect to various data sources, ingest streaming data, and deliver it to various targets.

For instance, consider how Striim enables the constant, continuous movement of unstructured, semi-structured, and structured data – extracting it from a wide variety of sources such as databases, log files, sensors, and message queues, and delivering it in real-time to targets such as Big Data, Cloud, Transactional Databases, Files, and Messaging Systems for immediate processing and usage.

Event/stream processing

The event processing layer provides the components necessary for handling data as it is ingested. Data coming into the system in real-time are often referred to as streams or events because each data point describes something that has occurred in a given period. These events typically require cleaning, enrichment, processing, and transformation in flight before they can be stored or leveraged to provide data. 

Therefore, another essential component for real-time data analytics is the infrastructure to handle real-time event processing.

Event/stream processing with Striim

Some data integration platforms, like Striim, perform in-flight data processing. This includes filtering, transformations, aggregations, masking, and enrichment of streaming data. These platforms deliver processed data with sub-second latency to various environments, whether in the cloud or on-premises.

Additionally, Striim can deliver data to advanced stream processing platforms such as Apache Spark and Apache Flink. These platforms can handle and process large volumes of data while applying sophisticated business logic.

Data storage

A crucial element of real-time analytics infrastructure is a scalable, durable, and highly available storage service to handle the large volumes of data needed for various analytics use cases. The most common storage architectures for big data include data warehouses and lakes. Organizations seeking a mature, structured data solution that focuses on business intelligence and data analytics use cases may consider a data warehouse. Data lakes, on the contrary, are suitable for enterprises that want a flexible, low-cost big data solution to power machine learning and data science workloads on unstructured data.

It’s rare for all the data required for real-time analytics to be contained within the incoming stream. Applications deployed to devices or sensors are generally built to be very lightweight and intentionally designed to produce minimal network traffic. Therefore, the data store should be able to support data aggregations and joins for different data sources — and must be able to cater to a variety of data formats.

Presentation/consumption

At the core of a real-time analytics solution is a presentation layer to showcase the processed data in the data pipeline. When designing a real-time architecture, keep this step at the forefront as it’s ultimately the end goal of the real-time analytics pipeline. 

This layer provides analytics across the business for all users through purpose-built analytics tools that support analysis methodologies such as SQL, batch analytics, reporting dashboards, and machine learning. This layer is essentially responsible for:

  • Providing visualization of large volumes of data in real time
  • Directly querying data from big stores, like data lakes and warehouses 
  • Turning data into actionable insights using machine learning models that help businesses deliver quality brand experiences 

What are Key Characteristics of a Real-Time Analytics System? 

To verify that a system supports real-time analytics, it must have specific characteristics. Those characteristics include: 

Low latency

In a real-time analytics system, latency refers to the time between when an event arrives in the system and when it is processed. This includes both computer processing latency and network latency. To ensure rapid data analysis, the system must operate with low latency. “Businesses can access the most accurate data since the system responds quickly and has minimal latency,” says Chow. 

High availability

Availability refers to a real-time analytics system’s ability to perform its function when needed. High availability is crucial because without it:

  • The system cannot instantly process data
  • The system will find it hard to store data or use a buffer for later processing, particularly with high-velocity streams 

Chow adds, “High availability guarantees uninterrupted operation.” 

Horizontal scalability 

Finally, a key characteristic of a successful real-time analytics system is horizontal scalability. This means the system can increase capacity or enhance performance by adding more servers to the existing pool. In cases where you cannot control the rate of data ingress, horizontal scalability becomes crucial, as it allows you to adjust the system’s size to handle incoming data effectively. “When the business adds more servers, the horizontal scalability feature of the system increases its flexibility even more by enabling it to handle more data and users,” shares Chow. “When combined, these characteristics ensure the system’s scalability, speed, and reliability as the business grows.” 

According to Rudakov, these three capabilities are crucial for several reasons. “[Low latency is important] because in order to move data for reasons above the operator needs data to get triggered ASAP with lowest latency possible,” he says. “Secondly, the system needs to be redundant with recovery support so that if it fails it comes back quickly and has no data loss. Finally, if the data is not moving fast enough, the operator needs to be able to easily scale the data moving system, i.e. add parallel components into the pipeline and add nodes into the cluster.” 

Rudakov adds that’s exactly why Striim is the right choice for a real-time analytics platform. “Striim provides all real time platform necessary elements described above: low latency pipeline controls such as CDC readers to read data in real time from database logs, recovery, batch policies, ability to run pipelines in parallel and finally multi-node cluster to support HA and scalability,” he says. “Additionally, it supports an easy drag and drop interface to create pipelines in a simple SQL based language (TQL).” 

Benefits of Real-Time Analytics

There are countless benefits of real-time analytics. Some include: 

To Optimize the Customer Experience 

According to an IBM/NRF report, post-pandemic customer expectations regarding online shopping have evolved considerably. Now, consumers seek hybrid services that can help them move seamlessly from one channel to another, such as buy online, pickup in-store (BOPIS), or order online and get it delivered to their doorstep. According to the IBM/NRF report, one in four consumers wants to shop the hybrid way. 

In order to enable this, however, retailers must access real-time analytics to move data from their supply chain to the relevant departments. Organizations today need to monitor their rapidly changing contexts 24/7. They need to process and analyze cross-channel data immediately. Just consider how Macy’s leveraged Striim to improve operational efficiency and create a seamless customer experience. “In many scenarios, businesses need to act in real time and if they don’t their revenue and customers get impacted,” says Rudakov. 

Real-time analytics also enhances personalization. It enables brands to deliver tailored content to consumers based on their actions on channels like websites, mobile apps, SMS, or email—instantly.

“Having access to real-time data allows a retail store to quickly respond to changes in demand for a certain item by adjusting inventory levels, launching focused marketing campaigns, or adjusting pricing techniques,” says Chow. “Similarly, companies may move quickly to address potential problems—like a drop in website performance or a decrease in consumer satisfaction—and mitigate negative consequences before they escalate.” 

To Stay Proactive and Act Quickly 

Another way businesses can leverage real-time analytics is to stay proactive and act quickly in case of an anomaly, such as with fraud detection. Unfortunately, fraud is a reality for innumerable businesses, regardless of size. However, real-time analytics can help organizations identify theft, fraud, and other types of malicious activities. Because of this, leveraging real-time analytics is a powerful way to ensure your business is staying proactive and able to move quickly if something goes wrong. 

This is especially important as these malicious online activities have seen a surge over the past few years. Consumers lost more than $10 billion to fraud in 2023, according to the Federal Trade Commission

“At some point a major credit card company used our platform to read network access logs and call an ML model to detect hacker attempts on their network,” shares Rudakov. 

For example, companies can use real-time analytics by combining it with machine learning and Markov modeling. Markov modeling is used to identify unusual patterns and make predictions on the likelihood of a transaction being fraudulent. If a transaction shows signs of unusual behavior, it then gets flagged. 

To Improve Decision-Making

Using up-to-date information allows organizations to know what they are doing well and improve. Conversely, it allows them to identify pitfalls and determine how to improve. 

For instance, if a piece of machinery isn’t working optimally in a manufacturing plant, real-time analytics can collect this data from sensors and generate data-driven insights that can help technicians resolve it. 

Real-time Use Cases in Different Industries

The benefits of real-time analytics vary just as the use cases do. Let’s walk through several use cases of real-time analytics platforms. 

Supply chain

Real-time analytics in supply chain management can enable better decision-making. Managers can view real-time dashboard data to oversee the supply chain and strategize demand and supply. “Management of the supply chain is another example [of a real-time analytics use case]. By monitoring shipments and inventory data, real-time analytics allow companies to quickly fix delays or shortages,” says Chow. 

Some of the other ways real-time analytics can help organizations include:

  • Feed live data to route planning algorithms in the logistics industry. These algorithms can analyze real-time data to optimize routes and save time by going through traffic patterns on roadways, weather conditions, and fuel consumption. 
  • Use aggregation of real-time data from fuel-level sensors to resolve fuel issues faced by drivers. These sensors can provide data on fuel level volumes, consumption, and dates of refills. 
  • Collect real-time data from electronic logging devices (ELD) to study driver behavior and improve it. This data provides valuable insights into driving patterns, enabling fleet managers to implement targeted training and safety measures 

Finance

In certain industries, such as commodities trading, market fluctuations require organizations to be agile. Real-time analytics can help in these scenarios by intercepting changes and empowering organizations to adapt to rapid market fluctuations. Financial firms can use real-time analytics to analyze different types of financial data, such as trading data, market prices, and transactional data. 

Consider the case of Inspyrus (now MineralTree), a fintech company seeking to improve accounts payable operations for businesses. The company wanted to ensure its users could get a real-time view of their transactional data from invoicing reports. However, their existing stack was unable to support real-time analytics, which meant that it took a whole hour for data updates, whereas some operations could even take weeks. There were also technical issues with moving data from an online transaction processing (OLTP) database to Snowflake in real time. 

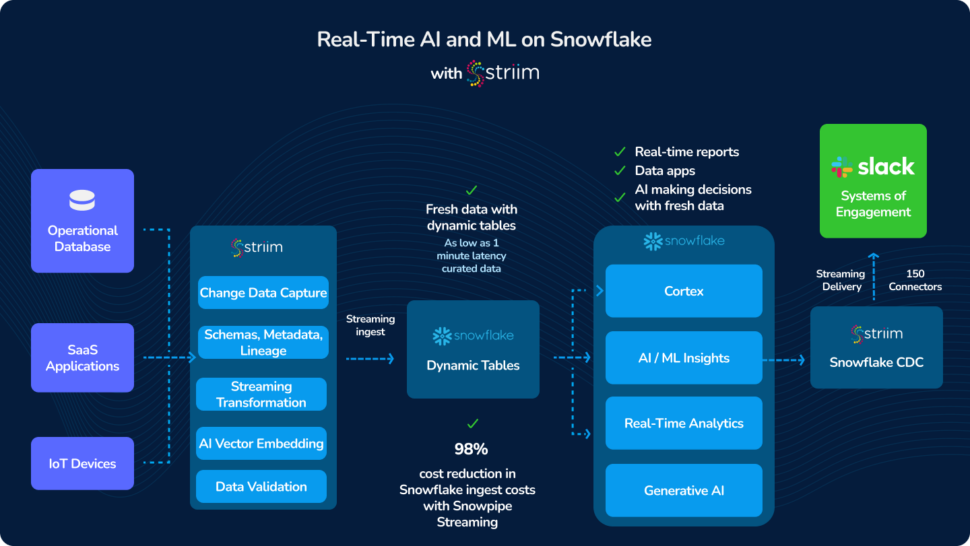
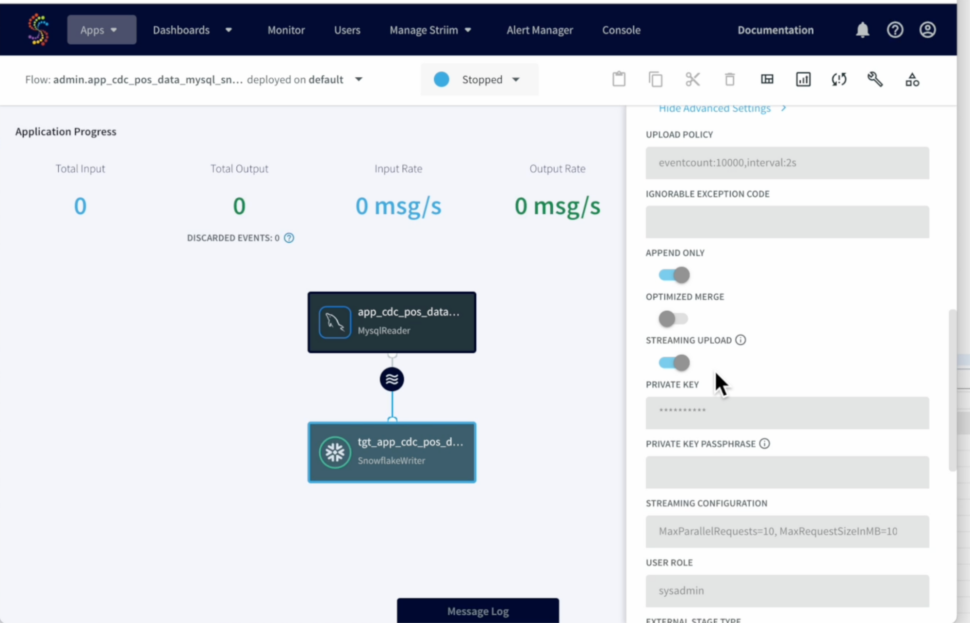
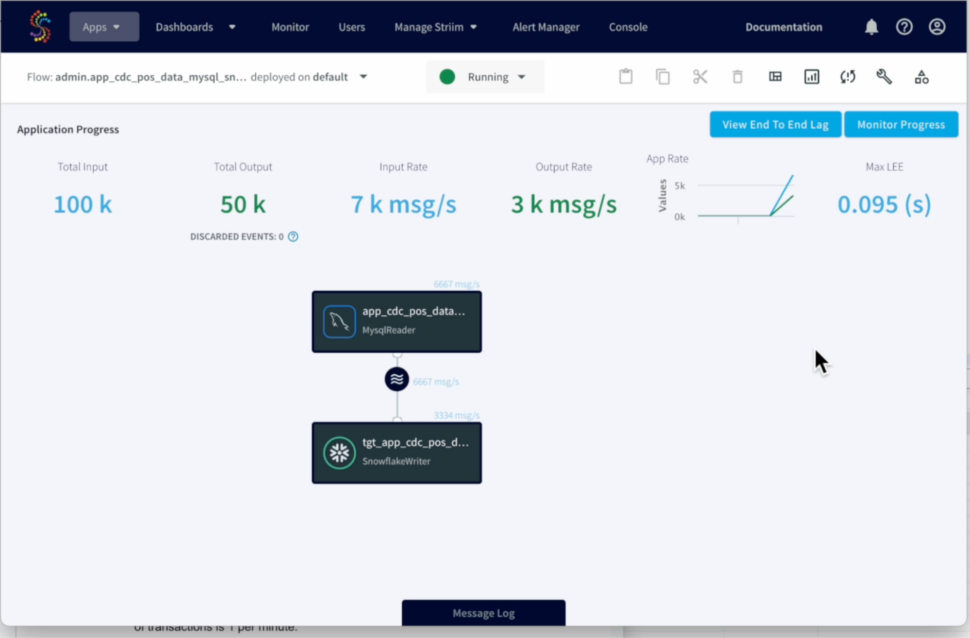
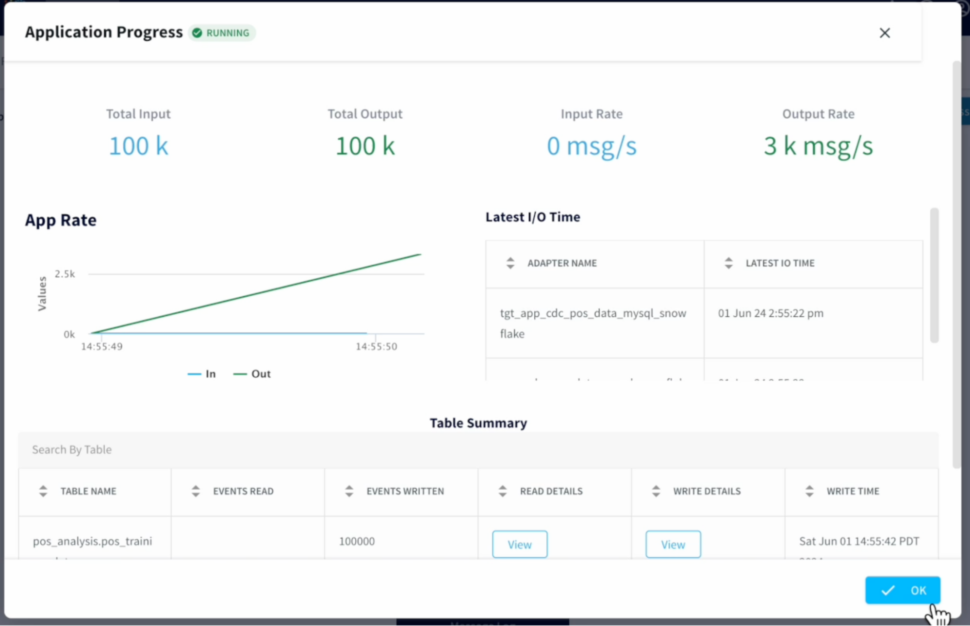
By utilizing Striim, Inspyrus ingested real-time data from an OLTP database, loaded it into Snowflake, and transformed it there. It then used an intelligence tool to visualize this data and create rich reports for users. As a result, Inspyrus users are able to view reports in real time and utilize insights immediately to fuel better decisions. 

Use Striim to power your real-time analytics infrastructure

Your real-time analytics infrastructure can be only as good as the tool you use to support it. Striim is a unified real-time data integration and streaming platform that enables real-time analytics that can offer a range of benefits in this regard. It can help you:

  • Collect data non-intrusively, securely, and reliably, from operational sources (databases, data warehouses, IoT, log files, applications, and message queues) in real time
  • Stream data to your cloud analytics platform of choice, including Google BigQuery, Microsoft Azure Synapse, Databricks Delta Lake, and Snowflake
  • Offer data freshness SLAs to build trust among business users
  • Perform in-flight data processing such as filtering, transformations, aggregations, masking, enrichment, and correlations of data streams with an in-memory streaming SQL engine
  • Create custom alerts to respond to key business events in real time

When seeking a real-time analytics platform, look no further than Striim. Striim, a unified real-time data integration and streaming platform, connects clouds, data, and applications. You can leverage it to connect hundreds of enterprise sources, all while supporting data enrichment, the creation of complex in-flight data transformations with Striim, and more. “Striim uses log-based Change Data Capture (CDC) technology to capture real-time changes from the source database and continuously replicate the data in-memory to multiple target systems, all without disrupting the source database’s operation,” says Chow. 

Ready to discover how Striim can help evolve how you process data? Sign up for a demo today.

Driving Retail Transformation: How Striim Powers Seamless Cloud Migration and Data Modernization

In today’s fast-paced retail environment, digital transformation is essential to stay competitive. One powerful way to achieve this transformation is by modernizing data architecture and migrating to the cloud. There are countless ways to leverage Striim but this is one of the most exciting, as the platform offers large retailers the tools they need to seamlessly transition from legacy systems to a more agile, cloud-based infrastructure.

Retailers often face the challenge of managing tremendous amounts of data, typically stored in cumbersome on-premises systems. Striim helps retailers liberate their data by tackling to significant areas: 

  • Enabling a data mesh for enhanced self-service analytics
  • Migrating from legacy systems, like Oracle Exadata, to Google Cloud

Let’s explore why these initiatives are imperative for retailers and how Striim plays a pivotal role in driving this transformation. 

Why Are These Initiatives Important?

For retailers, modernizing data architecture is not just about upgrading technology—it’s about empowering teams with better, faster access to data while future-proofing their infrastructure. Striim facilitates this transformation by enabling the implementation of a data mesh and supporting the migration to Google Cloud.

The data mesh approach decentralizes data management, making it easier for various teams across an organization to perform self-service analytics and derive actionable insights. This shift promotes a more collaborative and agile data culture, ultimately boosting business agility and responsiveness.

Migrating to Google Cloud, on the other hand, provides retailers with a scalable, flexible infrastructure that can handle increasing volumes of data. Striim’s real-time data integration ensures a smooth and seamless transition, minimizing disruptions and maintaining data integrity throughout the process.

Why Retailers Choose Striim

Many retailers are transitioning to Google Cloud, and managing real-time data migration presents a significant challenge across the industry. To address this, organizations require a robust, enterprise-grade solution for change data capture (CDC) to fill the gaps in their existing tools. After evaluating various options, many choose to move forward with proof of concept projects using Striim, confident in its ability to meet their needs and drive successful data transformation.

Striim is equipped to handle the complexities of modern retail environments, making it the leading choice for enterprises looking to enhance their data infrastructure. Whether it’s enabling a data mesh, supporting cloud migrations, or modernizing legacy systems, Striim provides the real-time data movement capabilities needed to drive successful digital transformation.

By leveraging Striim, retailers can ensure that their data transformation projects are not only effective but also aligned with their broader business goals.

Architecture and Striim’s Role 

Retailers transitioning to Google Cloud often require real-time data movement from their existing systems, such as Oracle databases, to cloud-based platforms like Google BigQuery. The typical architecture involves:

  • CDC Adapter: This component captures changes from source databases, ensuring that all data modifications are efficiently tracked and recorded. For instance, Striim’s Oracle CDC Adapter captures changes from source Oracle databases including the Retail Management System, Warehouse Management System, and Warehouse Execution System.
  • Cloud Integration Writer: This component pushes captured data in real-time to cloud targets, making it available for analysis as soon as it is generated. An example of this is BigQuery Writer, which pushes the captured data to BigQuery targets in real time.

This architecture supports key objectives for retailers:

  • Data Mesh Integration: By incorporating real-time data from operational systems into a data mesh, retailers ensure that stakeholders have access to up-to-date information, enhancing decision-making and analytics capabilities.
  • Cloud Migration Support: Continuous data movement from on-premises systems to cloud environments facilitates the transition to a scalable, flexible infrastructure capable of handling increasing volumes of data.

Striim’s advanced data integration capabilities streamline the migration process and improve data management efficiency, making it a valuable asset for retailers aiming to modernize their data architecture and migrate to the cloud.

Applicability to Other Use Cases

Striim’s capabilities highlight its value for various enterprise data transformation efforts, including:

  • Enabling Data Mesh Architectures: Striim provides the real-time data integration layer needed to populate domain-specific data products within a data mesh, ensuring that data is readily accessible across the organization.
  • Cloud Migrations: For organizations moving from on-premises databases to cloud data warehouses, Striim offers low-latency, continuous data replication to maintain synchronization between source and target systems.
  • Legacy System Modernization: Striim supports the transition from legacy systems by replicating data to modern cloud platforms in real time, facilitating a gradual and efficient modernization process.
  • Real-Time Analytics: By continuously streaming operational data to analytics platforms, Striim enables fresher insights and more timely decision-making.
  • Transformation Capabilities: By leveraging Striim, your team gains access to real-time transformation, allowing you to process and adapt data dynamically. Striim’s powerful transformation engine supports complex operations such as enrichment, filtering, and aggregation, ensuring your data is instantly optimized and ready for immediate use. 
  • Ease of Scalability: Striim was designed with scalability in mind, so regardless of how your team’s data volume increases, you can count on Striim for reliable performance. 

Striim’s real-time data integration is a crucial element for successful data transformation initiatives. Whether your organization is implementing a data mesh, migrating to the cloud, or modernizing its data stack, Striim provides the data movement capabilities essential for achieving effective digital transformation. Ready to discover how Striim can help drive your retail transformation? Request a demo to learn more. 

What are Smart Data Pipelines? 9 Key Smart Data Pipelines Capabilities

When implemented effectively, smart data pipelines seamlessly integrate data from diverse sources, enabling swift analysis and actionable insights. They empower data analysts and business users alike by providing critical information while protecting sensitive production systems. Unlike traditional pipelines, which can be hampered by various challenges, smart data pipelines are designed to address these issues head-on.

Today, we’ll dive into what makes smart data pipelines distinct from their traditional counterparts. We’ll explore their unique advantages, discuss the common challenges you face with traditional data pipelines, and highlight nine key capabilities that set smart data pipelines apart.

What is a Smart Data Pipeline? 

A smart data pipeline is a sophisticated, intelligent data processing system designed to address the dynamic challenges and opportunities of today’s fast-paced world. In contrast to traditional data pipelines, which are primarily designed to move data from one point to another, a smart data pipeline integrates advanced capabilities that enable it to monitor, analyze, and act on data as it flows through the system.

This real-time responsiveness allows organizations to stay ahead of the competition by seizing opportunities and addressing potential issues with agility. For instance, your smart data pipeline can rapidly identify and capitalize on an emerging social media trend, allowing your business to adapt its marketing strategies and engage with audiences effectively before the trend peaks. This gets you ahead of your competition. Alternatively, it can also help mitigate the impact of critical issues, such as an unexpected schema change in a database, by automatically adjusting data workflows or alerting your IT team to resolve the problem right away. 

In addition to real-time monitoring and adaptation, smart data pipelines leverage features such as machine learning for predictive analytics. This enables businesses to anticipate future trends or potential problems based on historical data patterns, facilitating proactive decision-making. Moreover, a decentralized architecture enhances data accessibility and resilience, ensuring that data remains available and actionable even in the face of system disruptions or increased demand.

To fully comprehend why traditional data pipelines are insufficient, let’s walk through some of their hurdles. 

What are the Challenges of Building Data Pipelines? 

Traditional data pipelines face several persistent issues that reveal the need for smarter solutions. Luckily, smart data pipelines can mitigate these problems.  

According to Dmitriy Rudakov, Director of Solution Architecture at Striim, there are two primary features that smart data pipelines have that traditional ones don’t. “[The] two main aspects [are] the ability to act in real time, and integration with SQL / UDF layer that allows any type of transformations,” he shares.

Furthermore, with traditional data pipelines, data quality remains a significant challenge, as manual cleansing and integration of separate sources can cause trouble. As a result, errors and inconsistencies can be introduced into your data. Integration complexity adds to the difficulty, with custom coding required to connect various data sources, leading to extended development times and maintenance hassles. Then, there’s the question of scalability and data volume. This is problematic for traditional pipelines as they often struggle with the increasing scale and velocity of data, resulting in performance bottlenecks. Plus, high infrastructure costs are another hurdle. 

With traditional data pipelines, the data processing and transformation stages can be rigid and labor-intensive, too. This makes it near impossible to adapt to new data requirements rapidly. Finally, traditional pipelines raise questions about pipeline reliability and security, as they are prone to failures and security vulnerabilities.

By moving to a smart data pipeline, you can rest assured that your data is efficiently managed, consistently available, and adaptable to evolving business needs. Let’s dive deeper into key aspects of smart data pipelines that allow them to address all of these concerns. 

9 Key Features of Smart Data Pipelines

Here are nine key capabilities of Smart Data Pipelines that your forward-thinking enterprise cannot afford to overlook.

Real-time Data Integration

Smart data pipelines are adept at handling real-time data integration, which is crucial for maintaining up-to-date insights in today’s dynamic business environment. These pipelines feature advanced connectors that interface seamlessly with a variety of data sources, such as databases, data warehouses, IoT devices, messaging systems, and applications. The best part? This all happens in real time. 

Rudakov believes this is the most crucial aspect of smart data pipelines. “I would zoom into [the] first [capability as the most important] — real time, as it gives one an ability to act as soon as an event is seen and not miss the critical time to help save money for the business. For example, in the IoT project we did for a car breaks manufacturer, if the quality alert went out too late the company would lose critical time to fix the device.” 

By supporting real-time data flow, smart pipelines ensure that data is continuously updated and synchronized across multiple systems. This enables businesses to access and utilize current information instantly, which facilitates faster decision-making and enhances overall operational efficiency. While traditional data pipelines face delays and limited connectivity, smart data pipelines are agile, and therefore able to keep pace with the demands of real-time data processing.

Location-agnostic

Another feature of the smart data pipeline is that it offers flexible deployment, making it truly location-agnostic. Your team can launch and operate smart data pipelines across various environments, whether the data resides on-premises or in the cloud.

This capability allows organizations to seamlessly integrate and manage data across various locations without being constrained by the physical or infrastructural limitations of traditional pipelines.

Additionally, smart data pipelines are able to operate fluidly across both on-premises and cloud environments. This cross-environment functionality gives businesses an opportunity to develop a hybrid data architecture tailored to their specific requirements. 

Whether your organization is transitioning to the cloud, maintaining a multi-cloud strategy, or managing a complex mix of on-premises and cloud resources, smart data pipelines adapt to all of the above situations — and seamlessly. This adaptability ensures that data integration and processing remain consistent and efficient, regardless of where the data is stored or how your infrastructure evolves.

Applications on streaming data

Another reason smart data pipelines emerge as better than traditional is thanks to their myriad of uses. The utilization of smart data pipelines extend beyond simply delivering data from one place to another. Instead, smart data pipelines enable users to easily build applications on streaming data, ideally with a SQL-based engine that’s familiar to developers and data analysts alike. It should allow for filtering, transforming, and data enrichment, for use cases such as PII masking, data denormalization, and more.

Smart data pipelines also incorporate machine learning on streaming data to make predictions and detect anomalies (Think: fraud detection by financial institutions). They also enable automated responses to critical operational events via alerts, live monitoring dashboards, and triggered actions. 

Scalability

Scalability is another key capability. The reason smart data pipelines excel in scalability is because they leverage a distributed architecture that allocates compute resources across independent clusters. This setup allows them to handle multiple workloads in parallel efficiently, unlike traditional pipelines which often struggle under similar conditions.

Organizations can easily scale their data processing needs by adding more smart data pipelines, easily integrating additional capacity without disrupting existing operations. This elastic scalability ensures that data infrastructure can grow with business demands, maintaining performance and flexibility.

Reliability

Next up is reliability. If your organization has ever experienced the frustration of a traditional data pipeline crashing during peak processing times—leading to data loss and operational downtime—then you understand why reliability is of paramount importance. 

For critical data flows, smart data pipelines offer robust reliability by ensuring exactly-once or at-least-once processing guarantees. This means that each piece of data is processed either once and only once, or at least once, to prevent data loss or duplication. They are also designed with failover capabilities, allowing applications to seamlessly switch to backup nodes in the event of a failure. This failover mechanism ensures zero downtime, maintaining uninterrupted data processing and system availability even in the face of unexpected issues.

Schema evolution for database sources

Furthermore, these pipelines can handle schema changes in source tables—such as the addition of new columns—without disrupting data processing. Equipped with schema evolution capabilities, these pipelines allow users to manage Data Definition Language (DDL) changes flexibly. 

Users can configure how to respond to schema updates, whether by halting the application until changes are addressed, ignoring the modifications, or receiving alerts for manual intervention. This is invaluable for pipeline operability and resilience.

Pipeline monitoring

The integrated dashboards and monitoring tools native to smart data pipelines offer real-time visibility into the state of data flows. These built-in features help users quickly identify and address bottlenecks, ensuring smooth and efficient data processing. 

Additionally, smart data pipelines validate data delivery and provide comprehensive visibility into end-to-end lag, which is crucial for maintaining data freshness. This capability supports mission-critical systems by adhering to strict service-level agreements (SLAs) and ensuring that data remains current and actionable.

Decentralized and decoupled

In response to the limitations of traditional, monolithic data infrastructures, many organizations are embracing a data mesh architecture to democratize access to data. Smart data pipelines play a crucial role in this transition by supporting decentralized and decoupled architectures. 

This approach allows an unlimited number of business units to access and utilize analytical data products tailored to their specific needs, without being constrained by a central data repository. By leveraging persisted event streams, Smart Data Pipelines enable data consumers to operate independently of one another, fostering greater agility and reducing dependencies. This decentralized model not only enhances data accessibility but also improves resilience, ensuring that each business group can derive value from data in a way that aligns with its unique requirements.

Able to do transformations and call functions

A key advantage of smart data pipelines is their ability to perform transformations and call functions seamlessly. Unlike traditional data pipelines that require separate processes for data transformation, smart data pipelines integrate this capability directly. 

This allows for real-time data enrichment, cleansing, and modification as the data flows through the system. For instance, a smart data pipeline can automatically aggregate sales data, filter out anomalies, or convert data formats to ensure consistency across various sources.

Build Your First Smart Data Pipeline Today

Data pipelines form the basis of digital systems. By transporting, transforming, and storing data, they allow organizations to make use of vital insights. However, data pipelines need to be kept up to date to tackle the increasing complexity and size of datasets. Smart data pipelines streamline and accelerate the modernization process by connecting on-premise and cloud environments, ultimately giving teams the ability to make better, faster decisions and gain a competitive advantage.

With the help of Striim, a unified, real-time data streaming and integration platform, it’s easier than ever to build Smart Data Pipelines connecting clouds, data, and applications. Striim’s Smart Data Pipelines offer real-time data integration to over 100 sources and targets, a SQL-based engine for streaming data applications, high availability and scalability, schema evolution, monitoring, and more. To learn how to build smart data pipelines with Striim today, request a demo or try Striim for free.

Real-Time Anomaly Detection with Snowflake and Striim: How to Implement It

By combining the transformative abilities of Striim and Snowflake, organizations will enjoy unprecedentedly powerful real-time anomaly detection. Striim’s seamless data integration and streaming capabilities, paired with Snowflake’s scalable cloud data platform, allow businesses to monitor and analyze their data in real time.

This integration enhances the detection of irregular patterns and potential threats, ensuring rapid response and mitigation. Leveraging both platforms’ strengths, companies can achieve higher operational intelligence and security, making real-time anomaly detection more effective and accessible than before.

We’re here to walk you through the steps necessary to implement real-time anomaly detection. We’ll also dive deeper into the goals of leveraging Snowflake and Stream for real-time anomaly detection.

What are the Goals of Leveraging Striim and Snowflake for Real-Time Anomaly Detection?

The central goal of leveraging Striim and Snowflake is to make anomaly detection possible down to the second.

Let’s dial in on some of the specific goals your organization can accomplish thanks to leveraging Striim and Snowflake.

Transform Raw Data into AI-generated Actions and Insights in Seconds

In today’s fast-paced business environment, the ability to quickly transform raw data into actionable insights is crucial. Leveraging Striim and Snowflake allows organizations to achieve this in seconds, providing a significant competitive advantage.

Striim’s real-time data integration capabilities ensure that data is continuously captured and processed, while Snowflake’s powerful analytics platform rapidly analyzes this data. The integration enables AI algorithms to immediately generate insights and trigger actions based on detected anomalies. This rapid processing not only enhances the speed and accuracy of decision-making but also allows businesses to proactively address potential issues before they escalate, resulting in improved operational efficiency and reduced risk.

Ingest Near Real-Time Point of Sales (POS) Training and Live Data into Snowflake Using Striim CDC Application

For retail and service industries, timely and accurate POS data is crucial. Using Striim’s Change Data Capture (CDC) application, businesses can ingest near real-time POS data into Snowflake, ensuring that training and live data are always up-to-date.

Striim’s CDC technology captures changes from various sources and delivers them to Snowflake in real time, enabling rapid analysis and reporting. This allows businesses to quickly identify sales trends, monitor inventory levels, and detect anomalies, leading to more informed decisions, optimized inventory management, and improved customer experience.

Predicting Anomalies in POS Data with Snowflake Cortex and Striim

Leveraging Snowflake Cortex and Striim, businesses can build and deploy machine learning models to detect anomalies in Point of Sale (POS) data efficiently. Snowflake Cortex offers an integrated platform for developing and training models directly within Snowflake, utilizing its data warehousing and computing power.

Striim enhances this process by providing real-time data integration and streaming capabilities. Striim can seamlessly ingest and prepare POS data for analysis, ensuring it is clean and up-to-date. Once prepared, Snowflake Cortex trains the model to identify patterns and anomalies in historical data.

After training, the model is deployed to monitor live POS data in real time, with Striim enabling continuous data streaming. This setup flags any unusual transactions or patterns promptly, allowing businesses to address potential issues like fraud or inefficiencies proactively.

By combining Snowflake Cortex and Striim, organizations gain powerful, real-time insights to enhance anomaly detection and safeguard their operations.

Detect Abnormalities in Recent POS Data with Snowflake’s Anomaly Detection Model

Your organization can also use Snowflake’s anomaly detection model in conjunction with Striim to identify irregularities in your recent POS data. Striim’s real-time data integration capabilities continuously stream and update POS data, ensuring that Snowflake’s model analyzes the most current information.

This combination allows for swift detection of unusual transactions or patterns, providing timely insights into potential issues such as fraud or operational inefficiencies. By integrating Striim’s data handling with Snowflake’s advanced analytics, you can effectively monitor and address abnormalities as they occur.

Use Striim to Continuously Monitor Anomalies and Send Slack Alerts for Unusual Transactions

When an unusual transaction is detected, Striim automatically sends instant alerts to your Slack channel, allowing for prompt investigation and response. This seamless integration provides timely notifications and helps you address potential issues quickly, ensuring more efficient management of your transactional data.

Now that you know the goals of leveraging Striim and Snowflake, let’s dive deeper into implementation.

Implementation Details

Here is the high level architecture and data flow of the solution:

Generate POS Data

The POS (Point of Sales) Training dataset was synthetically created using a Python script and then loaded into MySQL. Here is the snippet of Python script that generates the data:


					# Function to create training dataset of credit card transactions
def create_training_data(num_transactions):
    data = {
        'TRANSACTION_ID': range(1, num_transactions + 1),
        'AMOUNT': np.random.normal(loc=50, scale=10, size=num_transactions),  # Normal transactions
        'CATEGORY': np.random.choice(['Groceries', 'Utilities', 'Entertainment', 'Travel'], size=num_transactions),
        'TXN_TIMESTAMP': pd.date_range(start='2024-02-01', periods=num_transactions, freq='T')  # Incrementing timestamps
    }
    df = pd.DataFrame(data)
    return df
# Function to create  live dataset with 1% of anomalous data 
def create_live_data(num_transactions):
    data = {
        'TRANSACTION_ID': range(1, num_transactions + 1),
        # generate 1% of anomalous data by changing the mean value
        'AMOUNT': np.append(np.random.normal(loc=50, scale=10, size=int(0.99*num_transactions)),
                            np.random.normal(loc=5000, scale=3, size=num_transactions-int(0.99*num_transactions))), 
        'CATEGORY': np.random.choice(['Groceries', 'Utilities', 'Entertainment', 'Travel'], size=num_transactions),
        'TXN_TIMESTAMP': pd.date_range(start='2024-05-01', periods=num_transactions, freq='T')  # Incrementing timestamps
    }
    df = pd.DataFrame(data)
    return df
# Function to load the dataframe to table using sqlalchemy
def load_records(conn_obj, df, target_table, params):
    database = params['database']
    start_time = time.time()
    print(f"load_records start time: {start_time}")
    print(conn_obj['engine'])
    if conn_obj['type'] == 'sqlalchemy':
        df.to_sql(target_table, con=conn_obj['engine'], if_exists=params['if_exists'], index=params['use_index'])
    print(f"load_records end time: {time.time()}")


Striim – Streaming Data Ingest

Striim CDC Application loads data continuously from MySQL to Snowflake tables using Snowpipe Streaming API. POS transactions training data span 79 days starting from (2024-02-01 to 2024-04-20).


Build Anomaly Detection Model in Snowflake

Step 1: Create the table POS_TRAINING_DATA_RAW to store the training data.


					CREATE OR REPLACE TABLE pos_training_data_raw (
  Transaction_ID bigint DEFAULT NULL,
  Amount double DEFAULT NULL,
  Category text,
  txn_timestamp timestamp_tz(9) DEFAULT NULL,
  operation_name varchar(80),
  src_event_timestamp timestamp_tz(9) 
);


Step 2: Create the dynamic table dyn_pos_training_data to keep only the latest version of transactions that have not been deleted.


					CREATE OR REPLACE DYNAMIC TABLE dyn_pos_training_data 
LAG = '1 minute'
WAREHOUSE = 'DEMO_WH'
AS
SELECT * EXCLUDE (score,operation_name ) from (  
  SELECT
    TRANSACTION_ID, 
    AMOUNT, 
    CATEGORY, 
    TO_TIMESTAMP_NTZ(TXN_TIMESTAMP) as TXN_TIMESTAMP_NTZ, 
    OPERATION_NAME, 
    ROW_NUMBER() OVER (
        partition by TRANSACTION_ID order by SRC_EVENT_TIMESTAMP desc) as score
  FROM POS_TRAINING_DATA_RAW 
  WHERE CATEGORY IS NOT NULL 
) 
WHERE score = 1 and operation_name != 'DELETE';


Step 3: Create the view vw_pos_category_training_data_raw so that it can be used as input to train the time-series anomaly detection model.


					create or replace view VW_POS_CATEGORY_TRAINING_DATA(
	TRANSACTION_ID,
	AMOUNT,
	CATEGORY,
	TXN_TIMESTAMP_NTZ
) as 
SELECT 
    MAX(TRANSACTION_ID) AS TRANSACTION_ID, 
    AVG(AMOUNT) AS AMOUNT, 
    CATEGORY AS CATEGORY,
    DATE_TRUNC('HOUR', TXN_TIMESTAMP_NTZ) as TXN_TIMESTAMP_NTZ 
FROM DYN_POS_TRAINING_DATA
GROUP BY ALL 
;


Step 4: Time-series anomaly detection model

In this implementation, Snowflake Cortex’s in-built anomaly detection function is used. Here is the brief description of the algorithm from Snowflake documentation:

“The anomaly detection algorithm is powered by a gradient boosting machine (GBM). Like an ARIMA model, it uses a differencing transformation to model data with a non-stationary trend and uses auto-regressive lags of the historical target data as model variables.

Additionally, the algorithm uses rolling averages of historical target data to help predict trends, and automatically produces cyclic calendar variables (such as day of week and week of year) from timestamp data”.

Currently, Snowflake Cortex’s Anomaly detection model expects time-series data to have no gaps in intervals, i.e. the timestamps in the data must represent fixed time intervals. To fix this problem, data is aggregated to the nearest hour using the date_trunc function on the timestamp column (for example: DATE_TRUNC(‘HOUR’, TXN_TIMESTAMP_NTZ)). Please look at the definition of the view vw_pos_training_data_raw above.


					CREATE OR REPLACE SNOWFLAKE.ML.ANOMALY_DETECTION POS_MODEL_BY_CATEGORY(
  INPUT_DATA => SYSTEM$REFERENCE('VIEW', 'VW_POS_CATEGORY_TRAINING_DATA'),
  SERIES_COLNAME => 'CATEGORY',
  TIMESTAMP_COLNAME => 'TXN_TIMESTAMP_NTZ', 
  TARGET_COLNAME => 'AMOUNT',
  LABEL_COLNAME =>''
);


Detect Anomalies – Actual Data

Step 5: Create the table POS_LIVE_DATA_RAW to store the actual transactions.


					CREATE OR REPLACE TABLE pos_live_data_raw (
  Transaction_ID bigint DEFAULT NULL,
  Amount double DEFAULT NULL,
  Category text,
  txn_timestamp timestamp_tz(9) DEFAULT NULL,
  operation_name varchar(80),
  src_event_timestamp timestamp_tz(9) 
);


Step 6: Create a stream on pos_live_data_raw to capture the incremental changes

Dynamic tables currently have a minimum latency of 1 minute. To workaround this and minimize latencies, create a stream on pos_live_data_raw table.


					create or replace stream st_pos_live_data_raw on table pos_live_data_raw;
				

Step 7: Create the view vw_pos_category_live_data_new to be used as input to anomaly detection function

View gets the incremental changes on pos_live_data_raw from the stream, de-dupes the data , removes deleted records and aggregates the transactions by the hour of transaction time.


					create or replace view VW_POS_CATEGORY_LIVE_DATA_NEW(
	TRANSACTION_ID,
	AMOUNT,
	CATEGORY,
	TXN_TIMESTAMP_NTZ
) as 
with raw_data as (
  SELECT
    TRANSACTION_ID, 
    AMOUNT, 
    CATEGORY, 
    TO_TIMESTAMP_NTZ(TXN_TIMESTAMP) as TXN_TIMESTAMP_NTZ, 
    METADATA$ACTION OPERATION_NAME, 
    ROW_NUMBER() OVER (
        partition by TRANSACTION_ID order by SRC_EVENT_TIMESTAMP desc) as score
  FROM ST_POS_LIVE_DATA_RAW 
  WHERE CATEGORY IS NOT NULL 
), 
deduped_raw_data as (
    SELECT * EXCLUDE (score,operation_name )
    FROM raw_data
    WHERE score = 1 and operation_name != 'DELETE'
)
SELECT 
    max(TRANSACTION_ID) as transaction_id, 
    avg(AMOUNT) as amount, 
    CATEGORY as category  ,
    date_trunc('hour', TXN_TIMESTAMP_NTZ) as txn_timestamp_ntz 
FROM deduped_raw_data
GROUP BY ALL
;


Step 8: Create the dynamic table dyn_pos_live_data to keep only the latest version of live transactions that have not been deleted.


					-- dyn_pos_live_data 
CREATE OR REPLACE DYNAMIC TABLE dyn_pos_live_data 
LAG = '1 minute'
WAREHOUSE = 'DEMO_WH'
AS
SELECT * EXCLUDE (score,operation_name ) from (  
  SELECT
    TRANSACTION_ID, 
    AMOUNT, 
    CATEGORY, 
    TO_TIMESTAMP_NTZ(TXN_TIMESTAMP) as TXN_TIMESTAMP_NTZ, 
    OPERATION_NAME, 
    ROW_NUMBER() OVER (
        partition by TRANSACTION_ID order by SRC_EVENT_TIMESTAMP desc) as score
  FROM POS_LIVE_DATA_RAW 
  WHERE CATEGORY IS NOT NULL 
) 
WHERE score = 1 and operation_name != 'DELETE';


Step 9: Call DETECT_ANOMALIES to identify records that are anomalies.

In the following code block, incremental changes are read from vw_pos_category_live_data_new and the detect_anomalies function is called, results of the detect_anomalies function are stored in pos_anomaly_results_table and alert messages are generated and stored in pos_anomaly_alert_messages.

With Snowflake notebooks, the anomaly detection and generation of alert messages below can be scheduled to run every two minutes.


					 truncate table pos_anomaly_results_table;
    create or replace transient table stg_pos_category_live_data 
    as 
    select * 
    from vw_pos_category_live_data_new;
    -- alter table pos_anomaly_alert_messages set change_tracking=true;
    -- vw_dyn_pos_category_live_data is the old view 
    CALL POS_MODEL_BY_CATEGORY!DETECT_ANOMALIES(
      INPUT_DATA => SYSTEM$REFERENCE('TABLE', 'STG_POS_CATEGORY_LIVE_DATA'),
      SERIES_COLNAME => 'CATEGORY', 
      TIMESTAMP_COLNAME =>'TXN_TIMESTAMP_NTZ',
      TARGET_COLNAME => 'AMOUNT'
    );
    set detect_anomalies_query_id = last_query_id();
    insert into pos_anomaly_results_table 
    with get_req_seq as (
        select s_pos_anomaly_results_req_id.nextval as request_id 
    )
    select 
        t.*, 
        grs.request_id, 
        current_timestamp(9)::timestamp_ltz as dw_created_ts 
    from table(result_scan($detect_anomalies_query_id)) t
        , get_req_seq as grs 
    ;
    set curr_ts = (select current_timestamp);
    insert into pos_anomaly_alert_messages 
    with anomaly_details as (
        select 
            series, ts, y, forecast, lower_bound, upper_bound
        from pos_anomaly_results_table
        where is_anomaly = True
        --and series = 'Groceries'
    ),
    ld as (
        SELECT 
            *,
            date_trunc('hour', TXN_TIMESTAMP_NTZ) as ts 
        FROM DYN_POS_LIVE_DATA
    )
    select 
        ld.category as name,  
        max(ld.transaction_id) as keyval,
        max(ld.ts) as txn_timestamp, 
        'warning' as severity,
        'raise' as flag,
        listagg(
        'Transaction ID: ' || to_char(ld.transaction_id) || ' with amount: ' || to_char(round(amount,2)) || ' in ' || ld.category || ' category seems suspicious', ' n') as message 
    from ld 
    inner join anomaly_details ad 
        on ld.category = ad.series
        and ld.ts = ad.ts
    where ld.amount  1.5*ad.upper_bound
    group by all 
    ;


Step 10: Create Slack Alerts Application in Striim

Create a CDC Application in Striim to continuously monitor anomaly alert results and messages and send Slack alerts for unusual or anomalous transactions.

Here is a sample output of Slack alert messages of anomalous transactions:

Sovereign AI, Redpanda vs Apache Kafka, The Future of Data Streaming with Alex Gallego (CEO of Redpanda)

Prepare to transform your understanding of data and cloud architecture with visionary CEO Alex Gallego of Redpanda. Discover how Alex’s journey from building racing motorcycles and tattoo machines as a child led him to revolutionize stream processing and cloud infrastructure. This episode promises invaluable insights into the shift from batch to real-time data processing, and the practical applications across multiple industries that make this transition not just beneficial but necessary.

Explore the intricate challenges and groundbreaking innovations in data storage and streaming. From Kafka’s distributed logs to the pioneering Redpanda, Alex shares the operational advantages of streaming over traditional batch processing. Learn about the core concepts of stream processing through real-world examples, such as fraud detection and real-time reward systems, and see how Redpanda is simplifying these complex distributed systems to make real-time data processing more accessible and efficient for engineers everywhere.

Finally, we delve into emerging trends that are reshaping the landscape of data infrastructure. Examine how lightweight, embedded databases are revolutionizing edge computing environments and the growing emphasis on data sovereignty and “Bring Your Own Cloud” solutions. Get a glimpse into the future of data ownership and AI, where local inferencing and traceability of AI models are becoming paramount. Join us for this compelling conversation that not only highlights the evolution from Kafka to Redpanda but paints a visionary picture of the future of real-time systems and data architecture.

What’s New In Data is a data thought leadership series hosted by John Kutay who leads data and products at Striim. What’s New In Data hosts industry practitioners to discuss latest trends, common patterns for real world data patterns, and analytics success stories.

Back to top