Use Cases of Real-Time Analytics in the Supply Chain

real time analytics for supply chainThe supply chain industry is the backbone on which many industries rely, such as manufacturing and retail. It produces large amounts of valuable business data daily, but according to a McKinsey study, only 2% of companies have visibility into their supply base beyond the second tier (e.g. chip fabrication in the semiconductor supply chain). 

66% of supply chain companies believe using data analytics is of critical importance for their future operations, but extracting value from supply chain data isn’t easy. Since the industry is split into various areas — such as procurement, logistics, and warehouses — data silos are common, with data scattered across legacy systems and spreadsheets. This makes it challenging to collect and analyze supply chain data.

Smart data pipelines unify data from multiple sources and enable real-time analytics of supply chain data. This gives managers the ability to make decisions based on a summary of accurate and timely data in the form of charts, graphs, and dashboards — or respond to real-time alerts generated automatically. Real-time analytics in the supply chain helps to avoid stockouts, protect drivers, tackle supply and demand issues, and increase the overall efficiency and profitability. 

Boosts Decision-Making for Procurement 

Real-time analytics can help you collect and analyze procurement data for better decision-making. Procurement managers can pull and analyze different sets of data, including supplier and buyer information, benchmark price, price variance and fulfillment, and invoice unit. This data can be collected from an operational system like an enterprise resource planning (ERP) system. 

Spend analysis

You can use descriptive analytics to consolidate purchasing-related data and get insights to minimize costs without compromising efficiency. For example, you can use descriptive analytics to collect historical data for creating visualizations (e.g., reports) on spend analysis to work on budgeting. This can help to answer questions, such as:

  • What is the organization buying?
  • From where and for whom is the organization buying?
  • Which categories have the largest spend?

Supplier negotiation 

One way real-time analytics can save money is by monitoring the organization’s purchasing history and providing real-time insights via prescriptive analytics to compare supplier pricing. When this information is presented in real time in the form of detailed reports, sourcing teams can use it to negotiate with suppliers on pricing if it’s higher than competitors. This also benefits your relationship with the supplier; they can identify missed opportunities in sales that were lost to lower-priced alternatives.  

Introduces Better Visibility in Warehouses

According to a survey, around 70% of supply chain leaders said that they want better visibility into their warehouse. Real-time analytics can help manage warehouse operations and give visibility into inventory, fulfillment, labor, and production.

Automation

You can identify functions that take a lot of time, or where manual errors are recurrent (e.g., clerical errors), and incorporate automation to improve efficiency and save costs. 

Take picking products for order in warehouse operations, which can take a lot of time when done manually. Real-time analytics can use artificial intelligence for automated picking systems to streamline the process. These systems can use machine learning to analyze routes for picking and find the most efficient route for each item by reducing walking and sorting time. 

Inventory management 

Real-time analytics can help you to view, manage, and optimize inventory levels in real time. You can view top-selling, on-hand, and out-of-stock items on a dashboard. With a single view, you can adjust inventory in all warehouses. 

Your dashboard can show that your warehouse has plenty of products that aren’t in demand at the moment, whereas there’s not enough stock for in-demand products. This is done by analyzing data, such as seasonal influence (e.g., Black Friday), trend forecasts, and historical sales. 

Before you are out of stock, predictive analytics can be used for demand forecasting. It can balance your purchasing to get sufficient stock for the right products on time. These products can then be placed in pick-up and staging areas in the warehouse to improve the delivery time and enhance the customer experience. 

On a similar note, your dashboard can show dead stock — items stuck on the shelf for too long — and recommend ways to deal with it. For instance, you can get rid of dead stock by putting up a clearance sale on your e-commerce website or bundling it with other products at a discount price. 

Tracks Logistics Operations

You can use real-time analytics to improve your operational efficiency and reduce accidents. 

On-time and reliable delivery of goods

Real-time insights can make predictions on estimated transit times and improve planning for shipments. This is done by feeding real-time data to route planning algorithms that can map out the best possible route, helping your drivers avoid disruptions such as traffic jams and weather issues.

With smart sensors and the internet of things (IoT), you can notify key personnel about the status and condition of in-transit goods throughout the supply chain. For this purpose, sensors are used to monitor factors such as shock, humidity, light, temperature, and location. This can be especially useful to identify the likelihood of a food item going bad or a fragile product getting broken in real time, where the system generates an alert and sends it to the supply chain management. 

Accident prevention 

According to a study, every year, more than 20% of all fleet vehicles get into accidents. Most of these issues are traced to bad driver behaviors, which cause employers in the US a lot of direct and indirect damage. Poor driver behavior includes the following:

  • Driving when drowsy
  • Risky driving
  • Speeding
  • Harsh braking 

You can use real-time analytics with smart cams and electronic logging devices to assess driving behavior. For instance, you can capture data, such as when a driver accelerates quickly without keeping a safe distance between themselves and other vehicles or when a driver is often involved in harsh braking while changing lanes. With real-time analytics, you can get a single daily view that can detect drivers with recurrent driving patterns and enroll them in a driver safety awareness program.

Adopt Real-time Supply Chain Analytics With Striim

Now that you know about the different ways in which real-time analytics can improve supply chain performance, you need to look for a reliable tool that can help you to implement it on an enterprise level. For this purpose, consider looking into Striim for advanced analytics capabilities. 

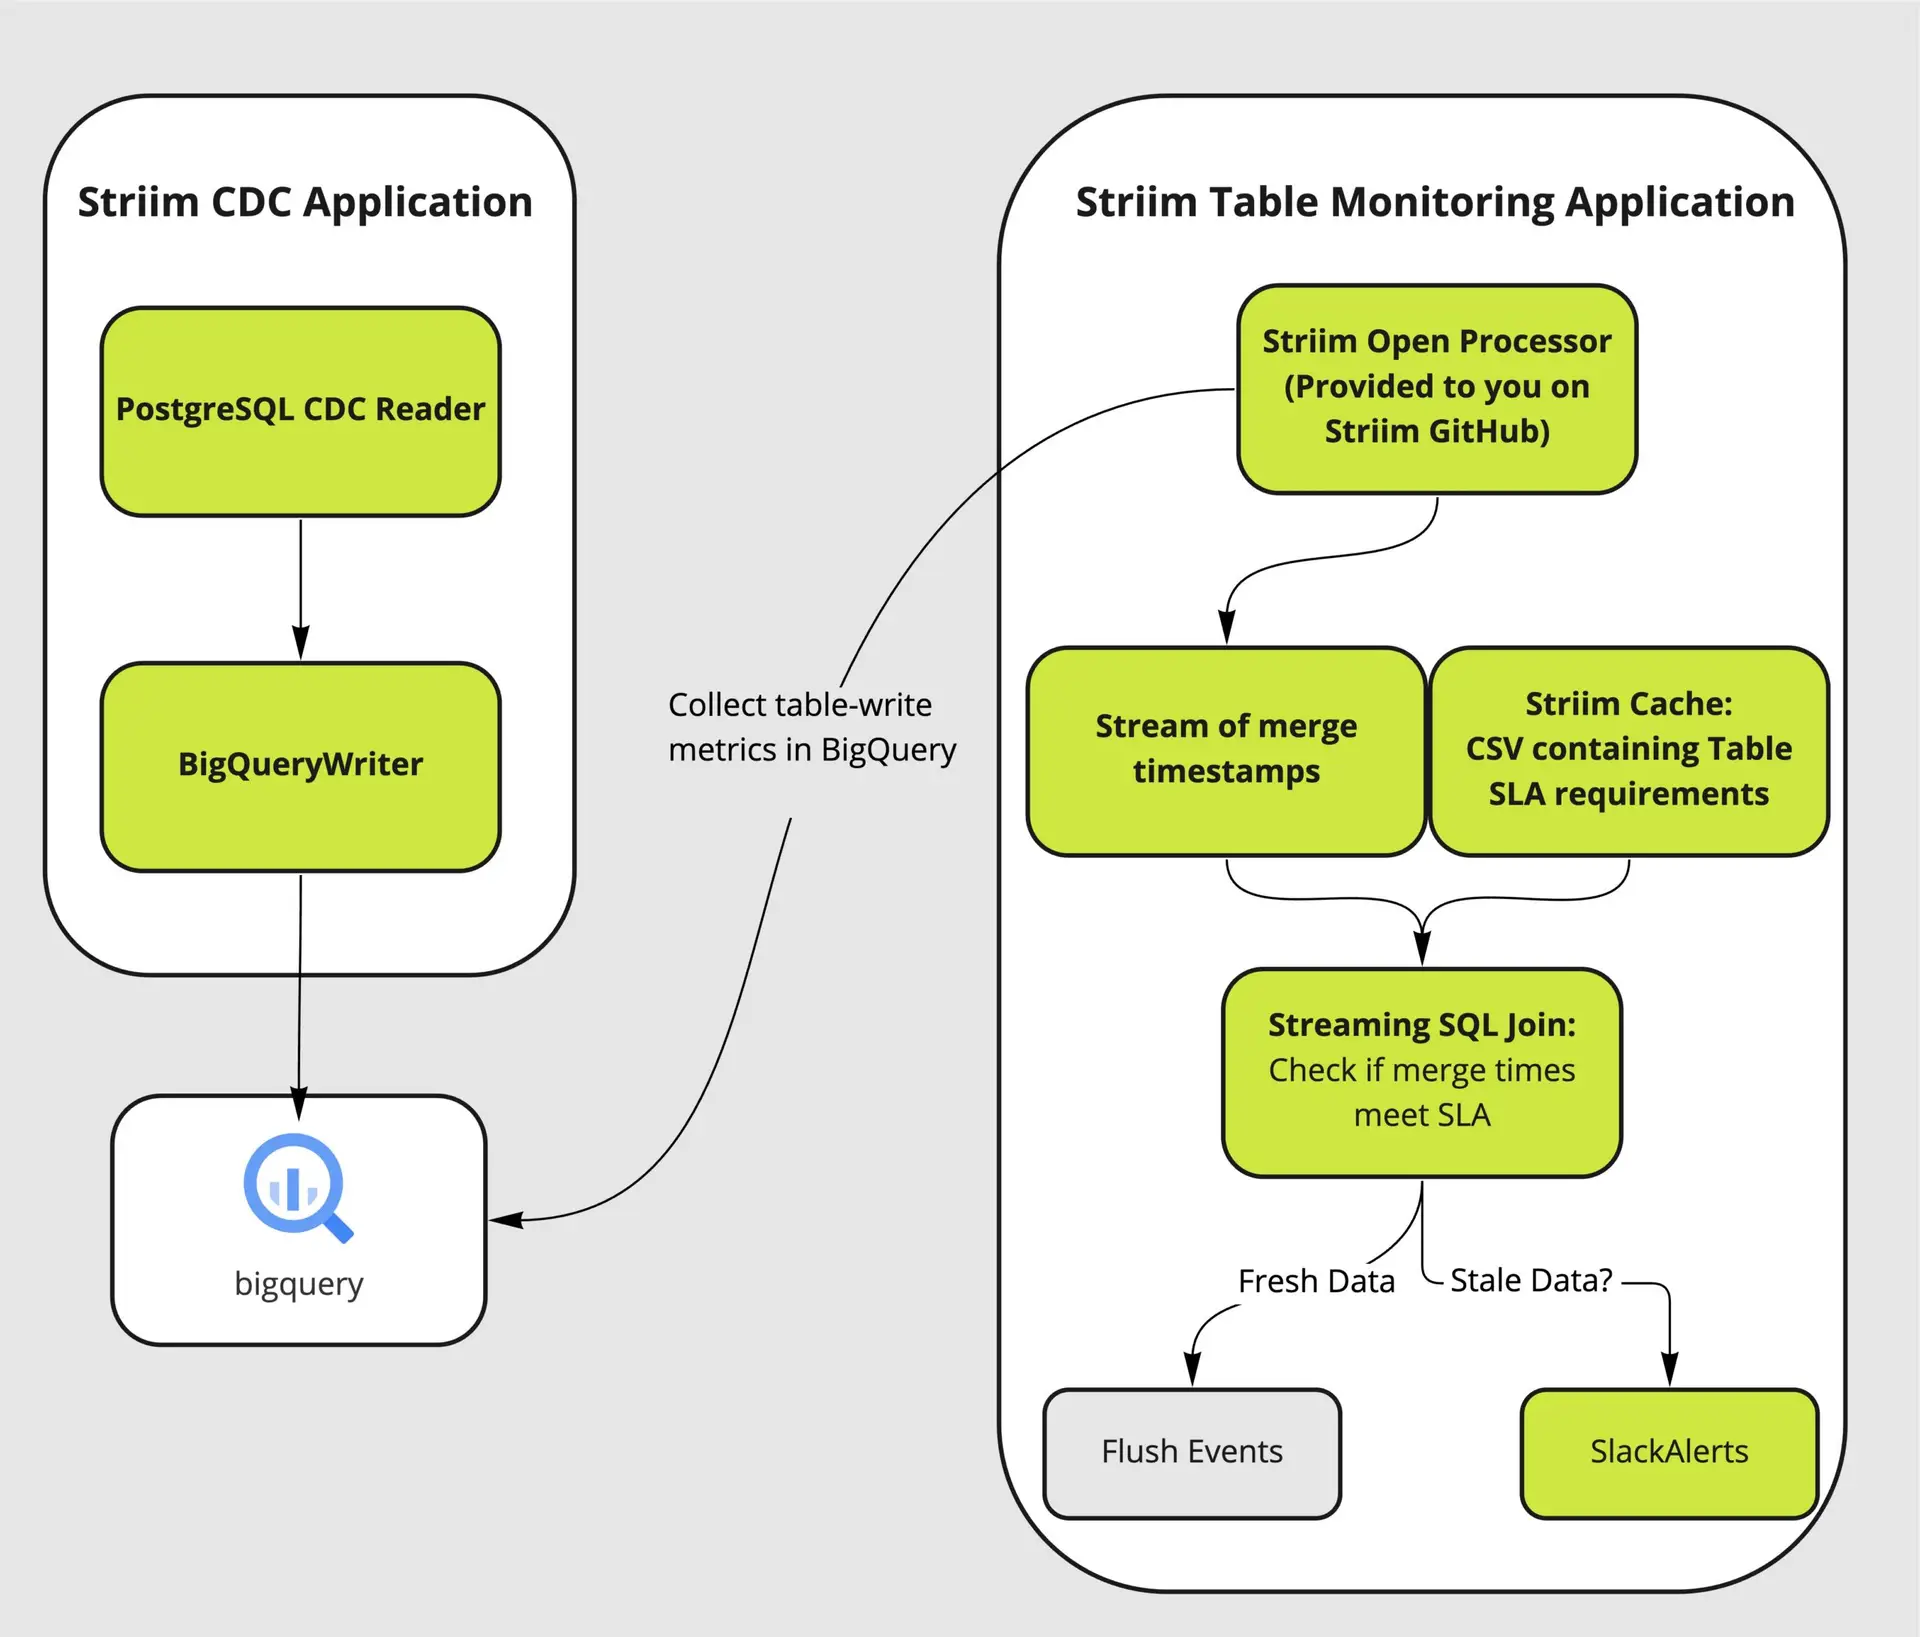
Striim is a real-time data integration and streaming platform that supports streaming analytics and delivery of fresh data to analytics systems. It acts as a real-time connector between your data sources (e.g. a warehouse management system) and destinations, like a cloud data warehouse that feeds into a business intelligence (BI) reporting tool like Tableau. No matter where your data resides, Striim can connect it — in real time — and provide actionable insights throughout your supply chain. 

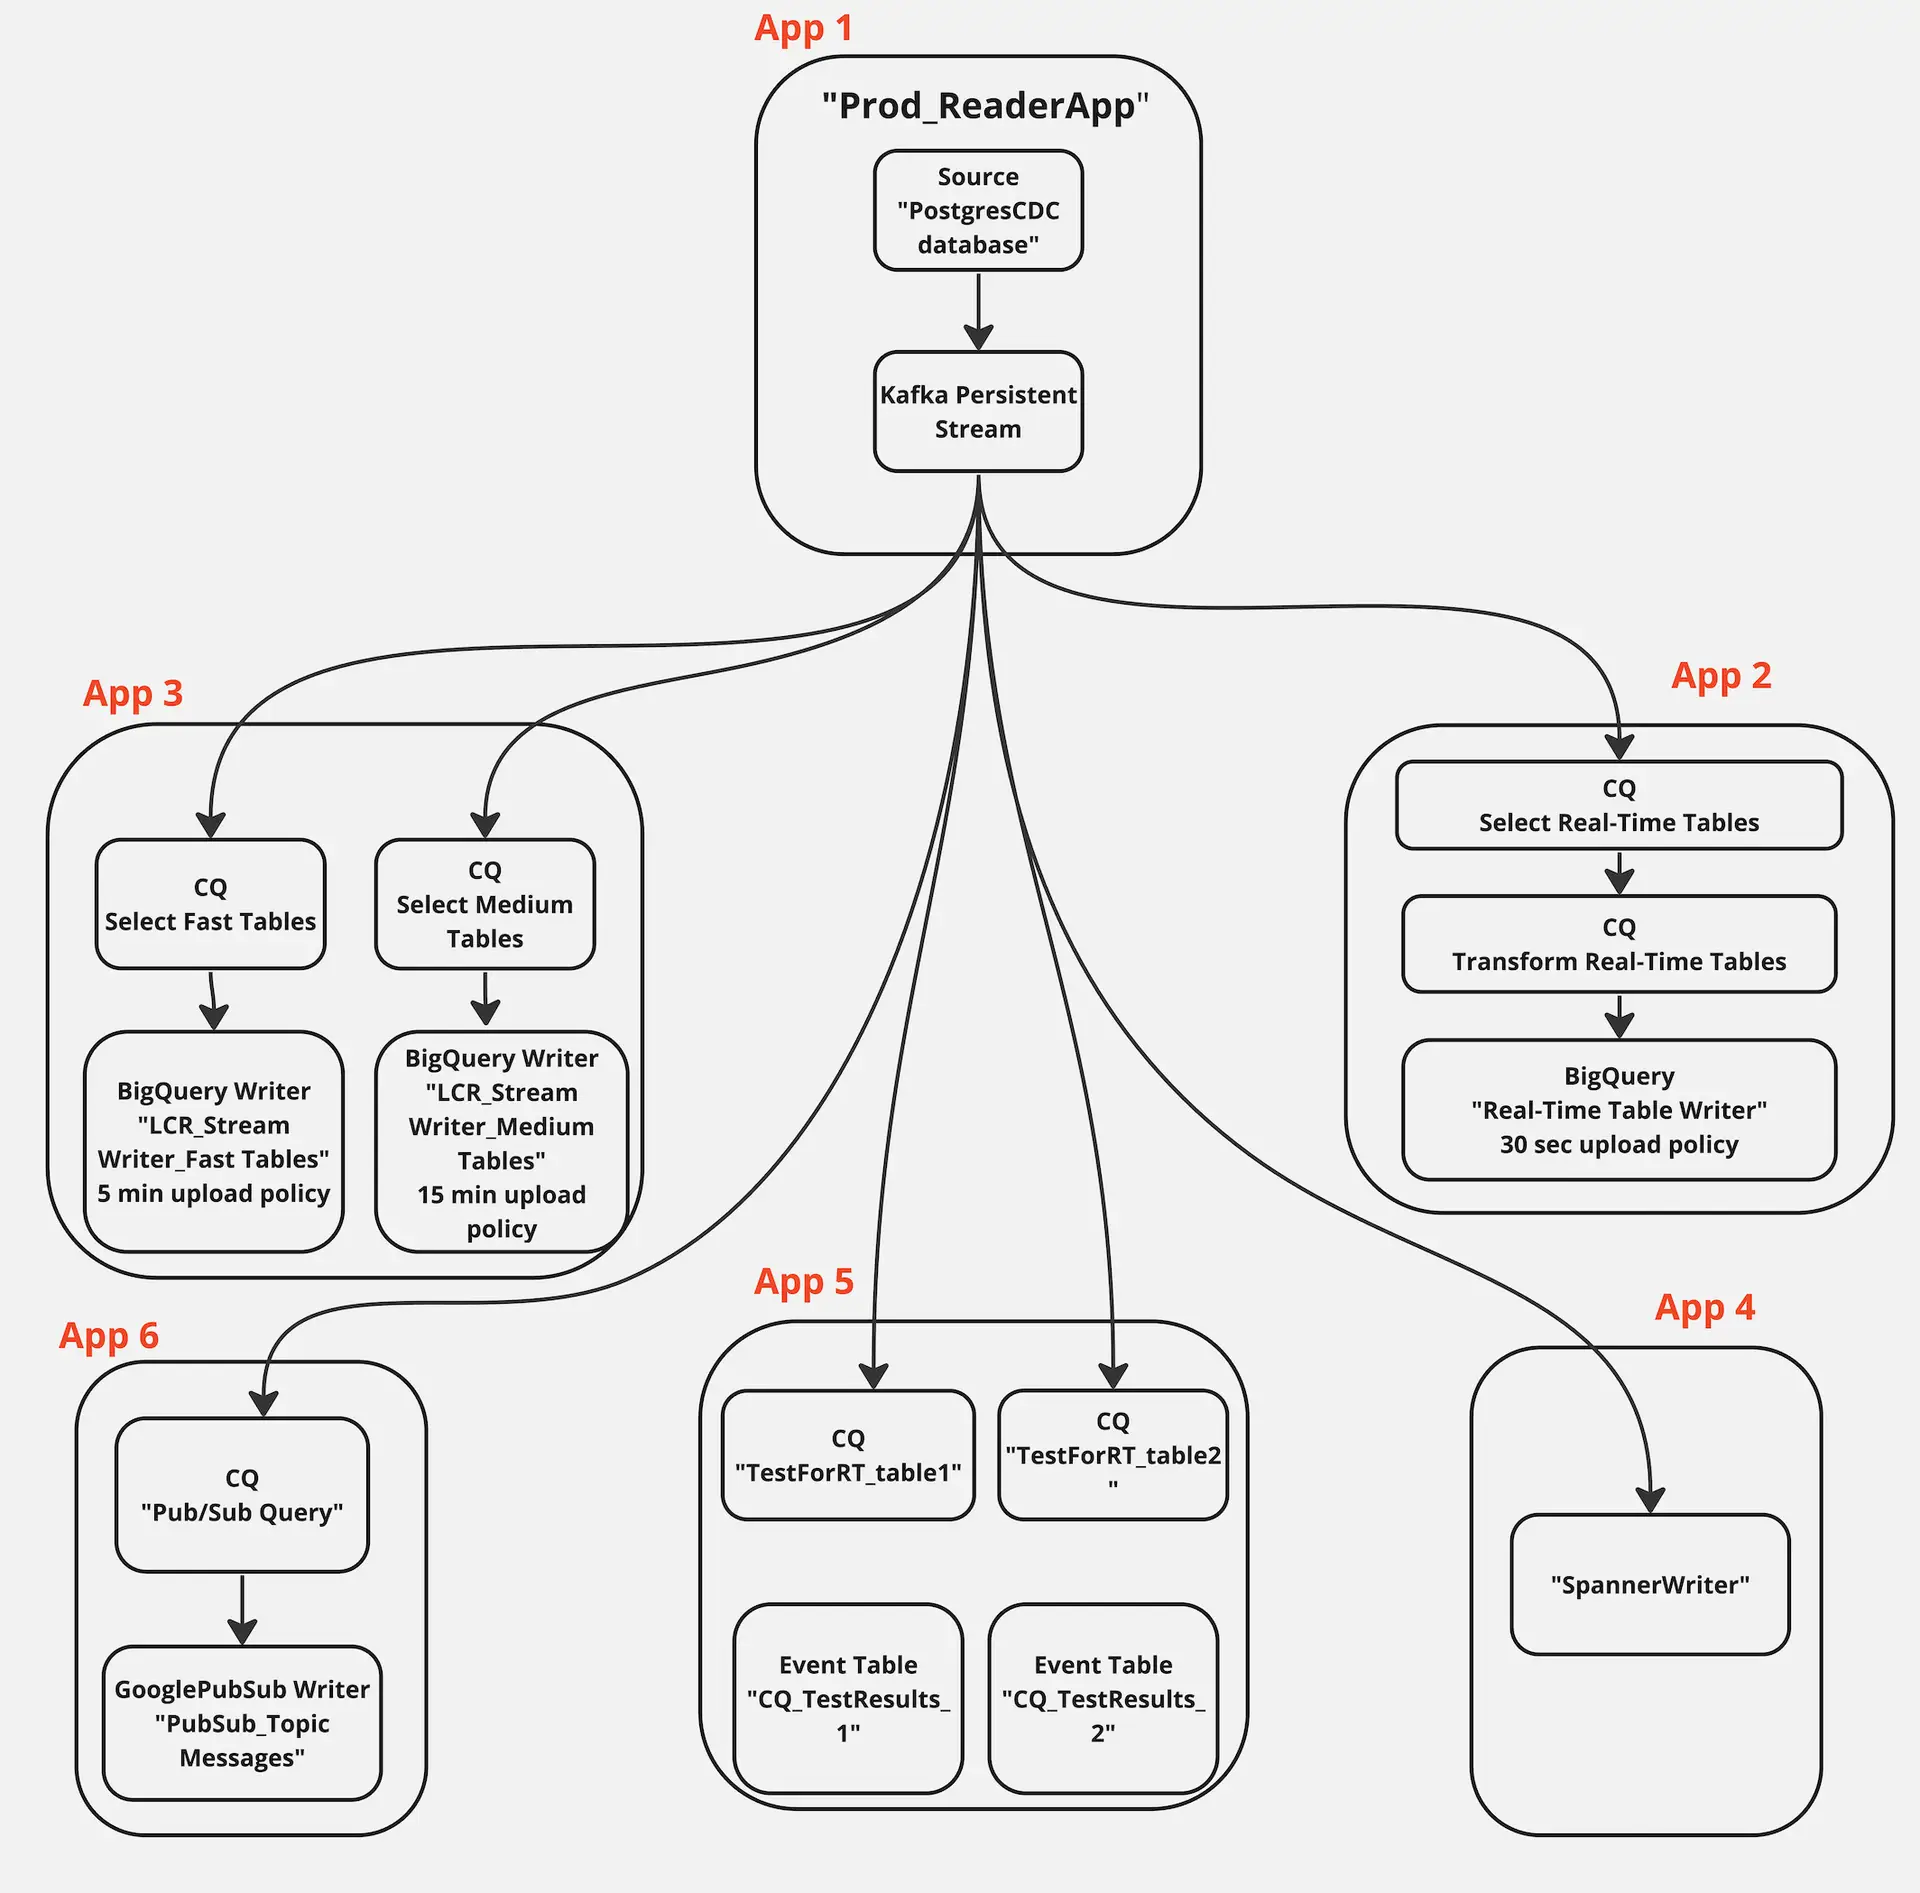
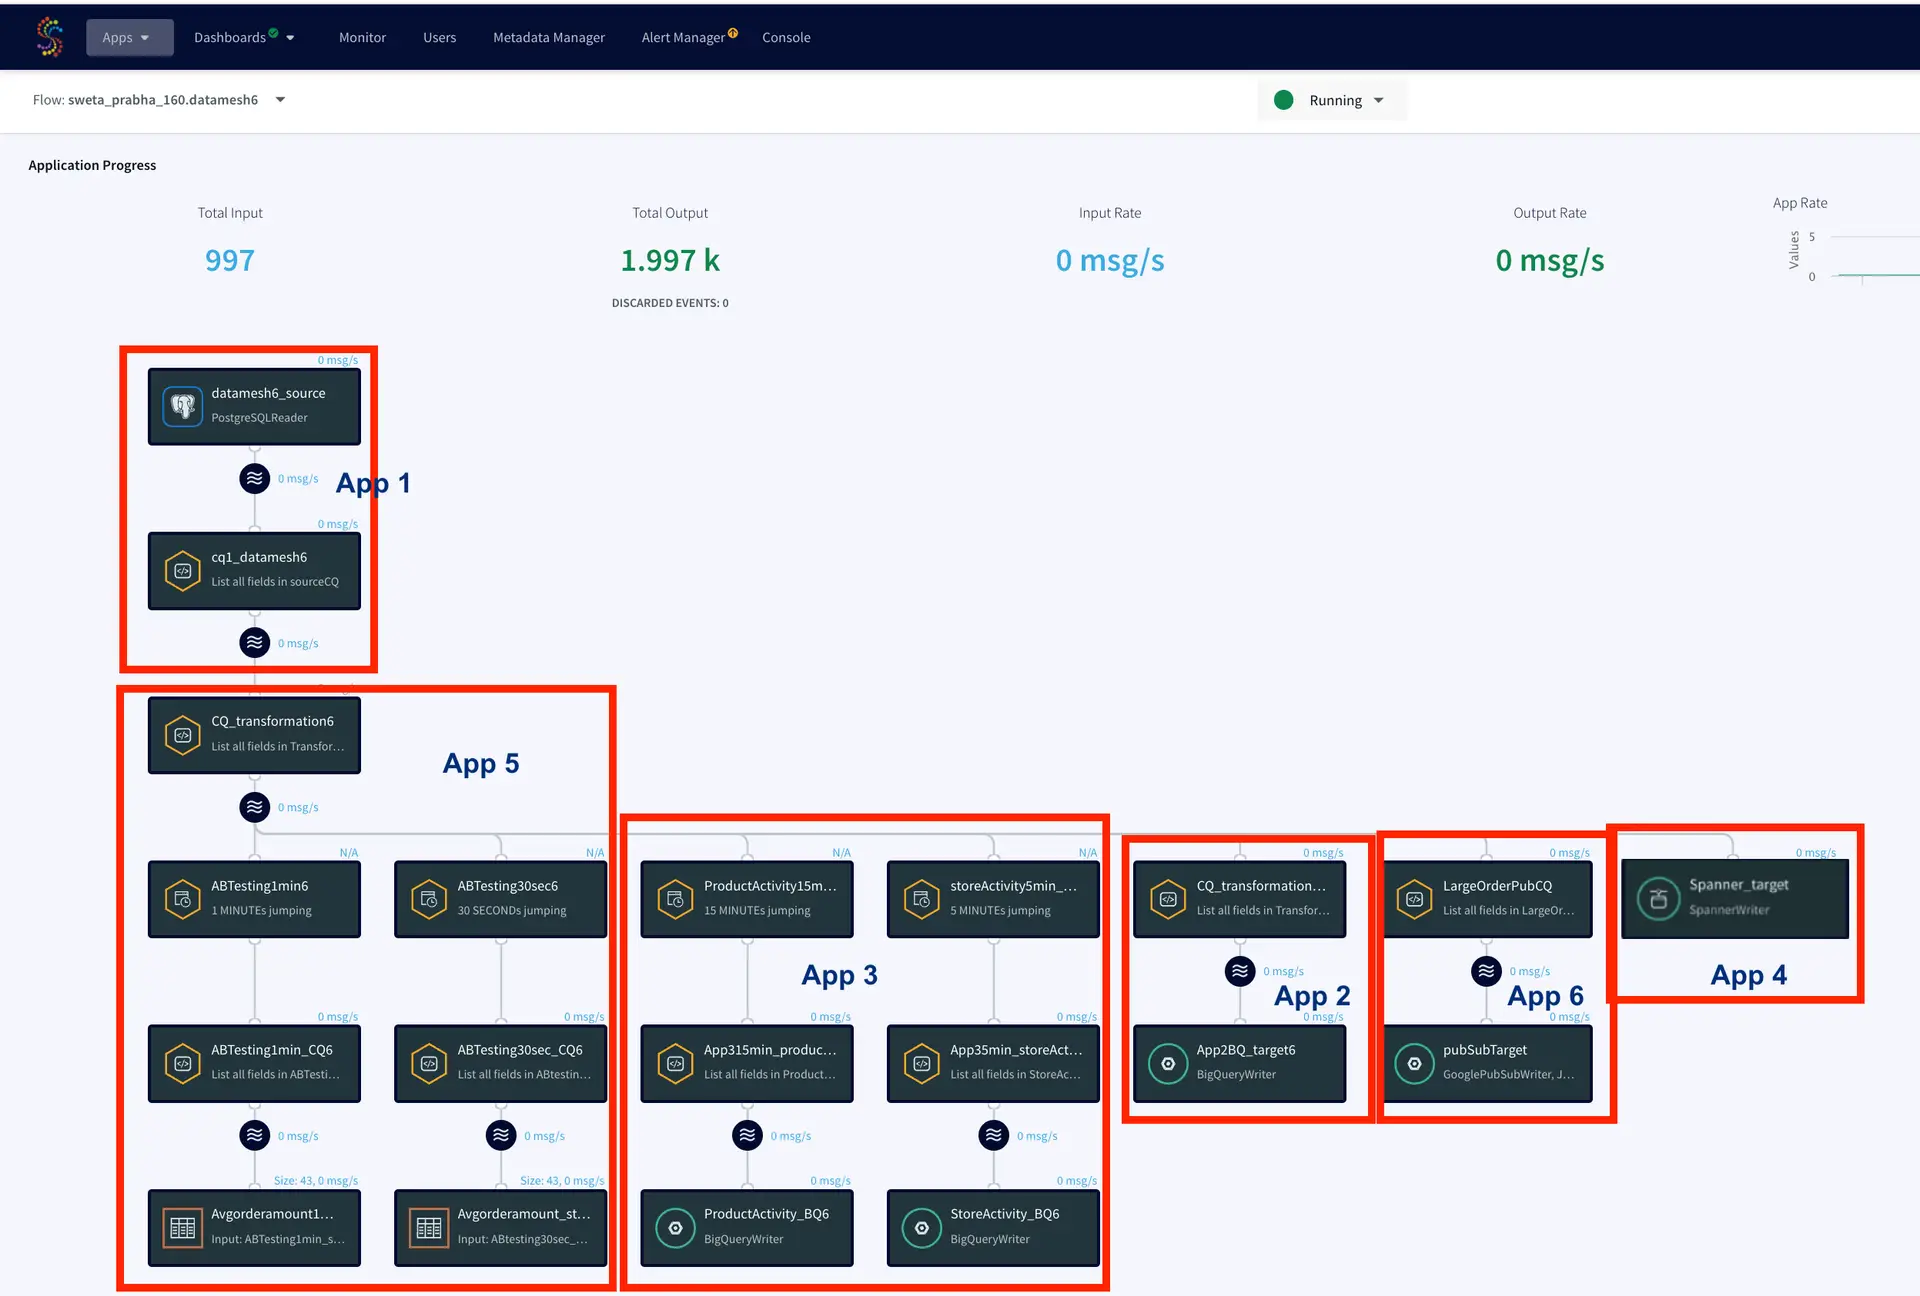
Striim has supported several organizations with their supply chain operations. For example, Striim has helped Macy’s, a leading retail chain, to adopt real-time inventory visibility. Below is a diagram that shows how Macy’s uses Striim to send real-time order and inventory data from its on-premise mainframe systems to business applications and dashboards in Google Cloud. This way, Macy’s has streamlined its inventory and has been able to adjust stock levels easily. 

how macy's uses striim

If you’re looking to modernize your supply chain to get a competitive advantage, learn more about Striim’s real-time analytics solution and request a free trial or sign up for a demo today. 

Building Real-Time Data Products with Data Streaming

John Kutay, PRODUCT MANAGER, Striim

Data leaders are evaluating methods to meet the various needs of cross-functional stakeholders. Some business users and customers need data in real-time, others need materialized views in a business format, and some want all of the above! Learn how data streaming and change data capture can decentralize your data operations.This talk will include specifics on sourcing data from collaborating operational systems (OLTP databases, sensors, API data) and transforming it into Data Products in the format of actionable business data with strong SLAs and SLOs for uptime and delivery speeds.

Stream data from Salesforce and Oracle to Azure Synapse

Tutorial

Stream data from Salesforce and Oracle to Azure Synapse

Benefits

Analyze real-time operational, and transactional data from Salesforce and Oracle in Synapse.

Leverage Synapse for instant scalability and accelerate Analytics and reporting

Use the power of Real-Time Data Streaming to build Real-Time analytical and ML models with Synapse

On this page

The advent of the Digital age created the need for robust and faster analytics, an essential part of every organization’s growth and success. Analysts and business executives rely on real-time data to derive insights into their business decisions.

Most of the pre-existing data pipelines in the industry are ETL based which gets bottlenecked with the Data transformation operations like aggregating, joining and other compute activities given the amount of data that is being generated or consumed. Data transformation is usually time-consuming and complex which has only increased with more streaming data sources that have come into play.

Why Salesforce?

Among the many data sources widely used, Salesforce has become one of the pivotal tools as part of any business process management by uniting the sales, service, marketing, and IT teams within a single shared view of customer information.

Why Striim with Salesforce?

Striim makes it easy to migrate data from Salesforce in minutes. After your data migration is complete, Striim can continuously sync Salesforce and a wide array of data sinks or targets with real-time data integration using change data capture.

This allows you to build real-time analytics and machine learning capabilities alongside Operational systems with minimal impact.

Why is Azure Synapse Analytics considered a powerhouse among data warehouses?

Synapse sets itself apart by providing key features such as  Azure Synapse Link which provides an end-to-end view of your business by easily connecting separate Microsoft data stores and automatically moving data without time-consuming extract, transform and load (ETL) processes. Synapse has an added advantage of integrations with Azure databricks, Spark, T-SQL, and Power BI all while using the same analytics service.

Optimizing pipelines through DB cache

In this recipe, we’ll explore how to create Salesforce and Oracle as a data sources and integrate them with Striim and Synapse. This recipe tutorial shows how retail order data in Salesforce is combined with sensitive PII  data of customers stored in Oracle and loaded into Synapse for analytics. More often in production use cases implemented in real life, some of the data sets used to generate analytics are static and don’t require a constant refresh. Most data sets can be categorized into daily refresh or weekly refresh depending on the characteristics and frequency at which data is being generated. To optimize these kinds of pipelines, we are going to use Striim’s DB cache which loads the static/non-real-time historical or reference data acquired from Oracle into the cache. This cached data is typically used by queries to enrich real-time data. If the source is updated regularly, the cache can be set to refresh the data at an appropriate interval.
Oracle DB cache can be replaced with Oracle CDC  as a source if the data source is more real-time oriented.

Feel free to sign up for a Free trial of Striim here

Step 1: Setting up Salesforce as a source

Login to your Salesforce and get the following connection parameters that are required for the Salesforce adapter in Striim.

Firstly, We would need the security token for the salesforce account, which is usually generated during account sign-up and received via email. We can also reset the security token by navigating to the User menu → My Settings →Under Personal tab → Reset My Security token. 

The sample data used in Salesforce connected app for this tutorial can be found in this github repository.

The easiest way to get the API endpoint is from the homepage after we log in to the salesforce profile.

We can also verify the API endpoint (instance_url) from the curl command which generates the Authentication token. Send a request to the Salesforce OAuth endpoint using this cURL template:

curl https://.my.salesforce.com/services/oauth2/token -d 'grant_type=password' -d 'client_id=' -d 'client_secret=' -d 'username=<my-login@domain.com>' -d 'password='

Replace MyDomainName with the domain for your Salesforce org. Replace consumer-key and consumer-secret with the consumer key and consumer secret of your connected app. Replace

my-login@domain.com and my-password with your login credentials for your Salesforce org and also append the security token with the password. If the request was unsuccessful and you’re unable to log in, see Troubleshoot Login Issues in Salesforce Help.

If the request was successful, the response contains an access token that you can use to access your data in Salesforce.

For example:

{"access_token":"00D5e000001N20Q!ASAAQEDBeG8bOwPu8NWGsvFwWNfqHOp5ZcjMpFsU6yEMxTKdBuRXNzSZ8xGVyAiY8xoy1KYkaadzRlA2F5Zd3JXqLVitOdNS",
"instance_url":"https://MyDomainName.my.salesforce.com",
"id":"https://login.salesforce.com/id/00D5e000001N20QEAS/0055e000003E8ooAAC",
"token_type":"Bearer",
"issued_at":"1627237872637",
"signature":"jmaZOgQyqUxFKAesVPsqVfAWxI62O+aH/mJhDrc8KvQ="}

For more information regarding authorizing apps with Oath, refer to this Salesforce Help page or Api rest developer docs.

Step 2: Configure the Salesforce Adapter in Striim

Login to your Striiim cloud instance and select Create App from the Apps dashboard.


Click on Start from scratch to build using the flow designer and name the application. Search for Salesforce under the search menu.

Enter the values and connection parameters derived from Step 1 of the Salesforce setup. The Consumer key and consumer secret are the client id and client secret from the curl command used above to generate the Auth token.

Note: Enable Auto auth token renewal under the settings. If not enabled, the app would crash since the curl command needs to be rerun manually to generate a new auth token.

Step 3: Configure the query to pull Salesforce records

Select the Continuous Query (CQ) processor from the drop-down menu and pass the following query to pull salesforce data from the Connected app that has been created. The query can be found in the following github repository.

Next, we search for Stream base component from the drop-down menu and configure the fields/columns for the next CQ processor.

Create a new Type , for example l2_type and add the fields or column names from the salesforce connected app and configure the datatype respectively.

For more information on Continous Query refer to the following documentation and for using Multiple CQs for complex criteria.

Step 4: Configure the Oracle Cache

Select the DB Cache from the drop-down menu and configure the Oracle database connection parameters.

Create a new type and add the respective field and datatypes for the fields.

The Oracle sample in this tutorial stores the sample data for customers’ sensitive information and can be found in this github repository.

Step 5: Configure the Query to pull Salesforce and Oracle data in real-time

Insert another CQ processor from the Components menu and pass the following query to pull the combined data of Oracle and salesforce data. The query can be found in the following github repository.

Create a new Stream from the Base components and create a new type that contains the enriched fields from oracle and salesforce and click Save.

Step 6: Configure the Synapse Target

Search for the Synapse Target component and select the input stream of the above CQ component.
For Synapse,  The connection URL needs to be in the following format:

jdbc:sqlserver://<synapse-workspace-name>.sql.azuresynapse.net:1433;database=<dedicated-pool-name>

Note: If you would like to use a serverless SQL pool the URL should look like this:

<Azure Synapse workspace name>-ondemand.sql.azuresynapse.net

Enter the account name and Account access key for the ADLS storage used by synapse.

Make sure the table already exists in Synapse and enter the target table name. The query to create the target table is available in the github repo

Set the Storage access driver type to ABFSS since the dedicated Synapse pool is using ADLS.

Once the app is configured, Click on the Deploy app from the top menu and Select Start  app


The data in synapse can be queried using Synapse studio or through Azure data studio.

Step 7: (Optional) Performing Spark analysis through in-built Synapse Spark pool

Create a new spark pool with the configuration of your choice. For this tutorial, we can choose one with the minimum requirements.

Once the spark cool is available, we can perform spark analytics on the data through the synapse itself.

Wrapping up: Start your free trial

Create a new spark pool with the configuration of your choice. For this tutorial, we can choose one with the minimum requirements.

The tutorial showed how data from multiple sources like Salesforce and Oracle can be combined using the Striim app and integrated with Synapse Datawarehouse. By Constantly moving real-time data into Synapse, we can build analytics or Machine learning models through spark within Synapse with minimal impacts on current systems with unparalleled performance.

Striim’s pipelines are portable between multiple clouds across hundreds of endpoint connectors including MongoDB, and Azure Cosmos, and also support other data warehouses including Google BigQuery, Snowflake, and Amazon Redshift.

As always, feel free to reach out to our integration experts to schedule a demo, or try Striim for free here.

Tools you need

Striim

Striim’s unified data integration and streaming platform connects clouds, data and applications.

Oracle

Oracle is a multi-model relational database management system.

Salesforce-logo

Salesforce

Salesforce is a popular CRM tool for support, sales, and marketing teams worldwide

Azure Synapse

Azure Synapse Analytics is a limitless analytics service that brings together data integration, enterprise data warehousing, and big data analytics

Use cases

Integrating Striim’s CDC capabilities with Salesforce makes it very easy to rapidly expand the capabilities of a CRM data with just a few clicks.

Striim’s additional components allow not only to capture real-time data, but also apply transformations on the fly before it even lands in the staging zone, thereby reducing the amount of data cleansing that is required.

The wide array of Striim’s event transformers makes it as seamless as possible with handling any type of sensitive data allowing users to maintain compliance norms on various levels.

Allow high-quality data into Synapse which can then be transformed via Spark code and integrate with Power BI or Tablueau for Visualizations.

Ensure Data Freshness with Streaming SQL

Tutorial

Ensure Data Freshness with Streaming SQL

Use Striim’s Streaming SQL to monitor and alert on lag between source and target systems

Benefits

Ensure Data Delivery SLAs
Monitor the data delivery in real-time to ensure it meets Service Level Agreement with your stakeholders

Simple Notifications in Email or Slack

Stream real-time alerts on stale data directly to your data teams via email or slack

Reliable Real-Time Analytics  Stream real-time data for operational analytics knowing your teams won’t fall behind
On this page

Overview

Striim is a unified data streaming and integration product that offers change data capture (CDC) enabling continuous replication from popular databases such as Oracle, SQLServer, PostgreSQL and many others to target data warehouses like BigQuery and Snowflake. Data loses its value over time and to make the most out of it, real-time analytics is the modern solution. It is important for streaming pipelines to deliver real-time data with desired SLAs required for the target application.

In this application, the OP will monitor the target and generate an output stream with monitoring metrics, such as target table names, last merge time, and lag in minutes. These monitoring metrics can be used to trigger conditional flows based on business needs. In this case, we are using this to alert specific users or integrated Slack channels.The service level of this tool in terms of data freshness is in minutes and so it will only indicate the possibility of loss or delay in minutes.

The table monitoring application can be paired with any striim app with different targets. The coupled application will alert customers if their expected data rates are not being achieved on the target component of the Striim app. This way users can identify tables that are stale for analytics use cases and triage.

Core Striim Components

PostgreSQL CDC: PostgreSQL Reader uses the wal2json plugin to read PostgreSQL change data. 1.x releases of wal2jon can not read transactions larger than 1 GB.

BigQueryWriter: Striim’s BigQueryWriter writes the data from various supported sources into Google’s BigQuery data warehouse to support real time data warehousing and reporting.

Open Processor: A Striim open processor contains a custom Java application that reads data from a window or stream, processes it, optionally enriching it with data from a cache, and writes to an output stream.

Streaming App

The utility tool can be paired with any Striim app with a variety of targets supported by Striim. For this recipe, our app replicates data from Postgres CDC to BigQuery. Please follow this recipe to learn how to set up a CDC user and configure Postgres CDC to BigQuery streaming application.

Monitoring Tables

There are four major components of the utility tool that couples with the user’s streaming app to analyze and alert on database tables that are falling behind their data delivery SLA to respective targets.

A Trigger input stream invokes  the monitoring Open Processor at specified time intervals. The Open Processor that contains a custom Java code  will monitor the target component and emit monitoring metrics as stream for the next component (in this case, Continuous Query) in the application flow The Continuous Query component then compares the table lag condition (specified in the user-provided spreadsheet) with the monitoring metrics from the OP. Finally, mailer target component will send  alerts when the SLA condition has not been met. The following functional diagram shows the architecture of the Table-level monitoring utility system.

Here is the Striim Utility app that fetches data from target and compares it against a benchmark to ensure table SLAs. You can download the TQL file from our github repository.

Trigger Input Stream

The Trigger input stream (TableLagHBCQ) passes a heartbeat (in this case 5 seconds) that acts as a trigger  to allow  the Open Processor to run its cycles  periodically. This periodic time interval can be modified by the user.

Open Processor

The OP component is the heart of this utility tool. It is designed by Striim’s engineering team for the purpose of table-level lag monitoring. It is in the form of a .scm file. Loading an Open Processor file requires a Global.admin role. Please reach out to cloud_support@striim.com to load the .scm file downloaded from our github repo. To upload the .scm file click on My files in the upper right corner and select the file from your local computer.

Once the file is uploaded, copy the file path and paste it into LOAD/UNLOAD OPEN PROCESSOR under Configuration -> App Settings as shown below:

Next, the user needs to configure the Open Processor Component inside the TQL file downloaded from our github account. The TQL file from the git repo should ideally look like this:

The user needs to add the OP component from the list of components in Striim:

The configuration of OP component is shown below:

Lag Threshold CSV and Continuous Query

This part of the application reads from a csv file uploaded in the same way as the .scm file in the previous step that contains the list of  Target Tables, lag threshold as per table SLAs and email in case of email adapter as the mailer alert. A sample file can be found in the github repository. The first column specifies all the table names that are monitored. The second column contains the SLA in minutes. The third column is used for email as mailer alert and can be skipped for slack alert.

If you are setting up the app from scratch, use a File reader component and specify the file path with DSVParser as shown below:

The Continuous Query has already been written for users in our tql file. It returns an alert message when the output lag time from the OP’s monitoring metrics is greater than the lag threshold specified by the user.

Slack Adapter as Mailer Target Component

For this use case, we have configured a Slack target component. Please follow the steps in this link  to configure slack to receive alerts from Striim. There is an additional Bot Token scope configuration for incoming-webhook. Please refer to the next image for scopes section.

Configure the slack adapter with the channel name and oauth token as shown below:

Setting Up the Utility

Step 1: Download the TQL files

You can download the TQL files for streaming app and lag monitor app from our github repository. Deploy the lag monitor app on your Striim server.

Step 2: Set up the source and Target for streaming app

You can use any Striim app of your choice and monitor the data freshness. Please checkout our tutorials and recipes to  learn how to set up streaming applications with various sources and targets.

Step 3: Edit the csv file

The first column of  lagthreshold csv file lists the names of target tables that are monitored and second column contains the SLA in minutes. The third column is optional and is used in case of email alerts. Upload the csv file and enter the filepath in the FileReader component of your app as explained in ‘Lag Threshold CSV and Continuous Query’ section of this recipe

Step 4: Upload the .scm file

If you do not have Global.admin permission, please reach out to cloud_support@striim.com to upload the OP .scm script. Once the .scm file is uploaded, follow the steps in ‘Open Processor’ section of this recipe to configure the open processor component.

Step 5: Set up the Slack Channel

Configure a slack channel with correct Bot Token and User Token Scopes as explained above. You can follow this link to set up the slack alerts. Generate the oauth token for your channel and configure the slack mailer component of the lag monitor app.

Next, you are ready to monitor the data rates through slack alerts for your streaming app.

Running the Application

Next, deploy and run the lag monitor app. When the streaming app (Postgres to BQ) is deployed, run, quiesced, stopped, halted or crashed, OP will be able to retrieve Monitoring Report and Slack alerts will be sent through mailer components accordingly. Here is a sample Slack alert notification for a lagging table.

Wrapping Up: Start your Free Trial Today

Our tutorial showed you how a striim utility tool created with an Open Processor component can help customers monitor table SLAs. The Slack alerts make it very easy to track data delivery rate and take action immediately in case of delays.

As always, feel free to reach out to our integration experts to schedule a demo, or try Striim for free here.

Tools you need

Striim

Striim’s unified data integration and streaming platform connects clouds, data and applications.

PostgreSQL

PostgreSQL is an open-source relational database management system.

Google BigQuery

BigQuery is a serverless, highly scalable multicloud data warehouse.

Building Real-Time Data Products on Google Cloud with Striim

Tutorial

Building Real-Time Data Products on Google Cloud with Striim

Leveraging Striim to create decoupled, decentralized real-time data products in Streaming SQL

Benefits

Domain Ownership

Transform raw change data capture logs to domain-specific business events in real-time

Decentralized Data

Use Striim to decentralize your data operations and provide self-service access to domain events

Data Contracts

Enforce contracts on schemas and data delivery SLAs across multiple business groups while minimizing load on the database

On this page

Overview

The Data Mesh – a concept coined by Zhamak Dehghani –  is emerging as a popular set of principles and methods to manage enterprise data with product-thinking and domain ownership. Without diving into the details of Data Mesh, we want to highlight the importance of self-service data access, generalizing data for consumption, and sparing superfluous technical details of sourced data from analytical models.

While monolithic data operations accelerated adoption of analytics within organizations, centralized data pipelines quickly grew into bottlenecks due to lack of domain ownership and focus on results.

To address this problem an approach called Data Mesh and tangential Data Mesh data architectures are rising in popularity. A data mesh is an approach to designing modern distributed data architectures that embrace a decentralized data management approach.

In the following, we will dive into ‘Collaborating operational systems as data sources’ of a data product using Chapter 12 of Zhamak Dehghani’s Data Mesh book as a reference. To be clear: this recipe is NOT labeling itself as a way to ‘build a data mesh’, rather how teams can architect a source-aligned data product with operational databases as the source which supports a Data Mesh strategy.  The other goal here is to create source aligned analytical data from an operational database rather than directly exposing change data capture logs to the analytical users.

“Common mechanisms for implementing the input port for consuming data from collaborating operational systems include asynchronous event-driven data sharing in case of modern systems, and change data capture.”. (Dehghani, 220)

In this data mesh use-case, we have shown how Striim aides decentralized architecture in the form of multiple decoupled Striim Applications with different data processing logic and delivery SLAs. We can leverage Striim for change data capture and persisted streams that can be consumed by separate targets to create data products.

The application created in this tutorial has five components serving five different teams. LCR data is read from a source database which is replicated and transformed in different streams. The data stream is persisted with a kafka message broker. The business architectural view of this application is shown below where Striim delivers real-time data to multiple consumers.

Benefits of Using Data Mesh
Domain Oriented Decentralization approach for data enables faster and efficient real-time cross domain analysis. A data mesh is an approach that is primitively based on four fundamental principles that makes this approach a unique way to extract the value of real-time data productively. The first principle is  domain ownership, that allows domain teams to take ownership of their data. This helps in domain driven decision making by experts. The second principle projects data as a product. This also helps teams outside the domain to use the data when required and with the product philosophy, the quality of data is ensured. The third principle is a self-serve data infrastructure platform. A dedicated team provides tools to maintain interoperable data products for seamless consumption of data by all domains that eases creation of data products. The final principle is federated governance that is responsible for setting global policies on the standardization of data. Representatives of every domain agree on the policies such as interoperability (eg: source file format), role based access for security, privacy and compliance

Data Contracts

Data Contracts are another pattern gaining popularity and can be built on top of Data Mesh’s innately decentralized, domain specific view of the world. We will not focus on how to build the Data Contracts in this specific recipe, but you can learn about how Striim’s unified change data capture and streaming SQL layer allows you to

  • Capture raw changes from your database with low impact CDC
  • Set parameters for Schema Evolution based on internal data contracts
  • Propagate compliant schema changes to consumers on an independent, table specific basis
  • Alert directly to Slack and other tools when schema contracts are broken
Data Contracts with Striim

Schematic Architecture to support Data Mesh Pattern

The data mesh shown in the next sections has six apps that is fed data from the same source through kafka persisted stream

App1: Production Database Reader

This application reads LCR data from a Postgres database and streams into a kafka persisted stream

App2: Real-Time BigQuery Writer

This application transforms data in-flight and writes to a BigQuery data warehouse with 30 secs SLA. The team needs the real-time transformed data for inventory planning.

App3: Near Real-Time BigQuery Writer

This application reads fast table with 5 min SLA and medium/near real-time tables with 15 min SLA and write into BigQuery tables with the respective upload policy

App4: Cloud Database Replication

This application replicate the incoming LCR data into a Google Spanner Database in real time

App5: A/B Testing Query Logic

This application compares data from two different version of CQ to find the best data that can be ingested to a model that forecasts average order amount

App6: Pub/Sub

This application records all the order values larger than $500 and writes it to an existing topic in Google cloud Pub/Sub

Core Striim Components

PostgreSQL CDC: PostgreSQL Reader uses the wal2json plugin to read PostgreSQL change data. 1.x releases of wal2jon can not read transactions larger than 1 GB.

Stream: A stream passes one component’s output to one or more other components. For example, a simple flow that only writes to a file might have this sequence

Continuous Query : Striim Continuous queries are are continually running SQL queries that act on real-time data and may be used to filter, aggregate, join, enrich, and transform events.

Window: A window bounds real-time data by time, event count or both. A window is required for an application to aggregate or perform calculations on data, populate the dashboard, or send alerts when conditions deviate from normal parameters.

Event Table: An event table is similar to a cache, except it is populated by an input stream instead of by an external file or database. CQs can both INSERT INTO and SELECT FROM an event table.

BigQueryWriter: Striim’s BigQueryWriter writes the data from various supported sources into Google’s BigQuery data warehouse to support real time data warehousing and reporting.

Google Pub/Sub Writer: Google Pub/Sub Writer writes to an existing topic in Google Cloud Pub/Sub.

Spanner Writer: Spanner Writer writes to one or more tables in Google Cloud Spanner.

Launch Striim Cloud on Google Cloud

The first step is to launch Striim Cloud on Google Cloud.  Striim Cloud is a fully managed service that runs on Google Cloud and can be procured through the Google Cloud Marketplace with tiered pricing. Follow this link to leverage Striim’s free trial for creating your own data-mesh. You can find the full TQL file (pipeline code) of this app in our github repo.

App 1: Production Database Reader

The first app reads the logical change streams from the production database into a ‘persistent stream’ that persists for 7 days. In this use case real-time Retail data is stored and is streamed from a Postgres database. The data consists real-time data of store id, skus and order details at different geographical locations.

Source Reader

Please follow this recipe to learn about how to set up a replication slot and user for a Postgres database that reads Change Data Capture in real-time.

Persistent Stream:

Striim natively integrates Apache Kafka, a high throughput, low-latency, massively scalable message broker. Using this feature developers can perform multiple experiments with historical data by writing new queries against a persisted stream. For a detailed description of this feature follow this link.

App 2: Real Time BigQuery Writer

In this application, the team needs inventory updates from each state in real time. The team takes care of the transportation of various different skus and does the inventory planning for each state to meet the forecasted demand. The application has a strict policy where real-time data must be available in BigQuery within 30 seconds. A Continuous Query transforms the data in-flight for analytics-ready operations rather than transforming in the warehouse.

The data is read from Kafka persisted stream, transformed in-flight and streamed to BigQuery target tables. To know more about how to set up a BigQuery target for Striim application, please follow this recipe.

App 3: Near Real-Time BigQuery Writer

In app 3 fast tables are selected from LCR (Logical Change Record) streams with 5 minute upload policy and medium/near-real time SLA tables are selected and written to BigQuery within 15 minutes upload policy. In this use case the Store activity data such as store id, order amount in each store and number of orders in each store are updated within 5 minutes whereas Product Activity such as number of orders for each sku are updated every 15 minutes on BigQuery table. This helps the relevant team analyze the store sales and product status that in turn is used for inventory and transportation planning.

App 4: Cloud Database Replication

For this app, the team needs real-time business data to be replicated to Spanner on GCP. The CDC data is read from Kafka persisted stream and replicated to Google Cloud Spanner.

App 5: A/B Testing CQ Logic

In this app, the team performs an experiment on stream with two different SLAs. The idea is to compare the average order amount of each state obtained from a 30 seconds window stream and 1 minute window stream for forecasting average order amount. The forecasting model is applied on each data stream to find out the best SLA for forecasting average order amount.The updated data is stored in an event table which can be read by the analytics team for A/B testing.

Continuous Query and Event Table

App 6: Google Pub/Sub Messaging App

In this app, the user wants to get a notification when a high value order is placed. The data is transformed in-flight using Continuous Query and all the orders greater than $500 are streamed into a google pub/sub topic which can be further subscribed by various teams.

Continuous Query and Pub/Sub Target Configuration

The topic is configured in Google Pub/Sub and the subscribers can pull the messages to see each new entry.

Running the Striim Pipelines

The following image shows the entire data mesh architecture designed using Striim as the streaming tool that replicated data to various targets with SLAs defined for each application.

Setting Up PostgreSQL to BigQuery Streaming Application

Step 1: Download the data and Sample TQL file from our github repo

You can download the TQL files for streaming app our github repository. Deploy the Striim app on your Striim server.

Step 2: Configure your Postgres CDC source

Set up your source and add the details in striim app

Step 3: Configure your BigQuery Targets

Add all the targets in this decentralized data-mesh application

Step 4: Set up Google Pub/Sub

Set up Google cloud Pub/Sub and add the details on Google Pub/Sub Writer component

Step 5: Set up Google Spanner

Set up Google Spanner and configure Spanner Writer Component on Striim app

Step 6: Deploy and run your Striim Data Mesh app

Run your app for decentralized real-time data streaming

Wrapping Up: Start your Free Trial Today

The above tutorial describes each component of a decentralized application in detail. As demonstrated, Striim’s pipelines are portable between multiple clouds across hundreds of endpoint connectors.

As always, feel free to reach out to our integration experts to schedule a demo, or try Striim for free here.

Tools you need

Striim

Striim’s unified data integration and streaming platform connects clouds, data and applications.

PostgreSQL

PostgreSQL is an open-source relational database management system.

Google BigQuery

BigQuery is a serverless, highly scalable multicloud data warehouse.

Google Cloud Pub/Sub

Google Cloud Pub/Sub is designed to provide reliable, many-to-many, asynchronous messaging between applications.

Google Cloud Spanner

Spanner is a distributed, globally scalable SQL database service

How Change Data Capture Enables Real-Time Data Streaming From Oracle Databases


Oracle CDC Webinar Replay

All businesses rely on data. Historically, this data resided in monolithic, on-premises databases, and for many enterprises, Oracle was the database of choice. As businesses modernize they are looking to the cloud for analytics and striving for real-time data insights. While they often find their legacy databases difficult to completely replace, the data and transactions happening within them are essential for analytics.

In order to unlock the full value of their data, companies need to stream critical transactions from their Oracle databases to their cloud provider, in real time. An easy way to do this is by using Change Data Capture (CDC). But not all CDC is created equal, and not all CDC solutions can handle mission-critical workloads.

Watch our on-demand technical webinar and demo, where we provide you with an overview of Striim’s Oracle CDC capabilities. We cover topics including:

  • Introduction to OJet, Striim’s new Oracle reader, that can read up to 150+ gigabytes of data per hour from Oracle (up to version-21c)
  • Demo: how to set up zero-downtime migrations/replications from Oracle to Google BigQuery from initial load to on-going, real-time synch. We also demo unique capabilities of Striim’s BigQuery writer including partition pruning and a streaming API.
  • An overview of Striim’s features that support high-volume, mission-critical enterprise environments

Presented by:

Sai Natarajan
VP Chief Field Technologist, Striim


Connect Data Sources and Targets

Striim makes it easy to connect to your sources with a point and click wizard. Select tables, migrate schemas, and start moving data in seconds.

Data Pipeline Monitoring

Visualize your pipeline health, end-to-end data latency, and table-level metrics. Plug in with Striim’s REST APIs.

How to Stream Data to Azure Synapse Analytics with Striim


Azure_Synapse_Webinar_July_2022_On-Demand

There is significant demand for zero downtime database migrations and continuous data replication as workloads shift to the cloud. Modernizing databases by offloading workloads to the cloud requires building real-time data pipelines from legacy systems.

The Striim® platform is an enterprise-grade cloud data integration solution that continuously ingests, processes, and delivers high volumes of streaming data from diverse sources, on-premises or in the cloud.

In this joint session with Striim partner Microsoft, we discuss why and how cloud and data architects/engineers use Striim to move data into Azure in a consumable form, quickly and with sub-second latency to easily run critical transactional and analytical workloads.

We also demonstrate how to use Striim to migrate or continuously replicate enterprise databases to Azure Synapse Analytics with no downtime:

  • Prepare Azure data targets or data integration with table creation that reflects the source database
  • Set up in-flight transformations right in the GUI to minimize end-to-end latency and enable real-time analytics & operational reporting
  • Deploy zero-downtime migrations to Azure from existing enterprise databases anywhere

Presented by:

Edward Bell
Senior Solutions Architect, Striim


Karlien Vanden Eynde
Director of Product Marketing Cloud Analytics, Microsoft
Back to top