The transfer of data from Atlassian Jira to Google BigQuery facilitates the scalable analysis of engineering metrics, encompassing cycle time, throughput, and issue trends. This enables forecasting and planning through the utilization of historical data for predictive insights. Moreover, with the application of BigQuery ML or external AI tools, teams can leverage machine learning to forecast delivery delays, identify anomalies, or prioritize issues based on historical patterns. Furthermore, the integration with platforms such as GitHub or Zendesk allows for a comprehensive analysis of cross-functional impacts.
This recipe shows how you can build a data pipeline to read data from Atlassian Jira and write to Google BigQuery. Striim’s Jira Reader will first read the existing tables from the configured Jira dataset and then write them to the target BigQuery project using the BigQuery Writer, a process called “initial load” in Striim and “historical sync” or “initial snapshot” by others. After completing the initial load, the Jira Reader will automatically transition to continuously reading updates from the configured Jira datasets, and then writing these source updates to the target BigQuery project using the BigQuery Writer. You can use the recipe to write into any of Striim supported targets.
Benefits
Striim’s JIRA Reader improves your ability to manage large-scale data with high throughput and low latency.
Real-time data flow ensures that you can process and analyze information as it comes in, offering immediate insights for decision-making.
Step – 1 – Prep Work
Setting up Jira as source
You can connect to your Jira source by authenticating using API token or setting up an Atlassian client app for manual OAuth. For this recipe, we will be using the API token for authentication.
You will need an API token for authentication for setting up the connection to Jira, the list of steps are:
Log in to your Atlassian account.
Navigate to the Security tab.
Click on Create API token.
Provide a label for the token.
Click Create.
Copy the generated API token to clipboard.
Store the API token securely.
Follow the steps in this link to setup an Atlassian client app for manual OAuth. Configure the Striim Jira Reader with the JSON access token when the OAuth authentication method is in use.
Setting up BigQuery as Target
Create an account in BigQuery where you can access the transferred data.
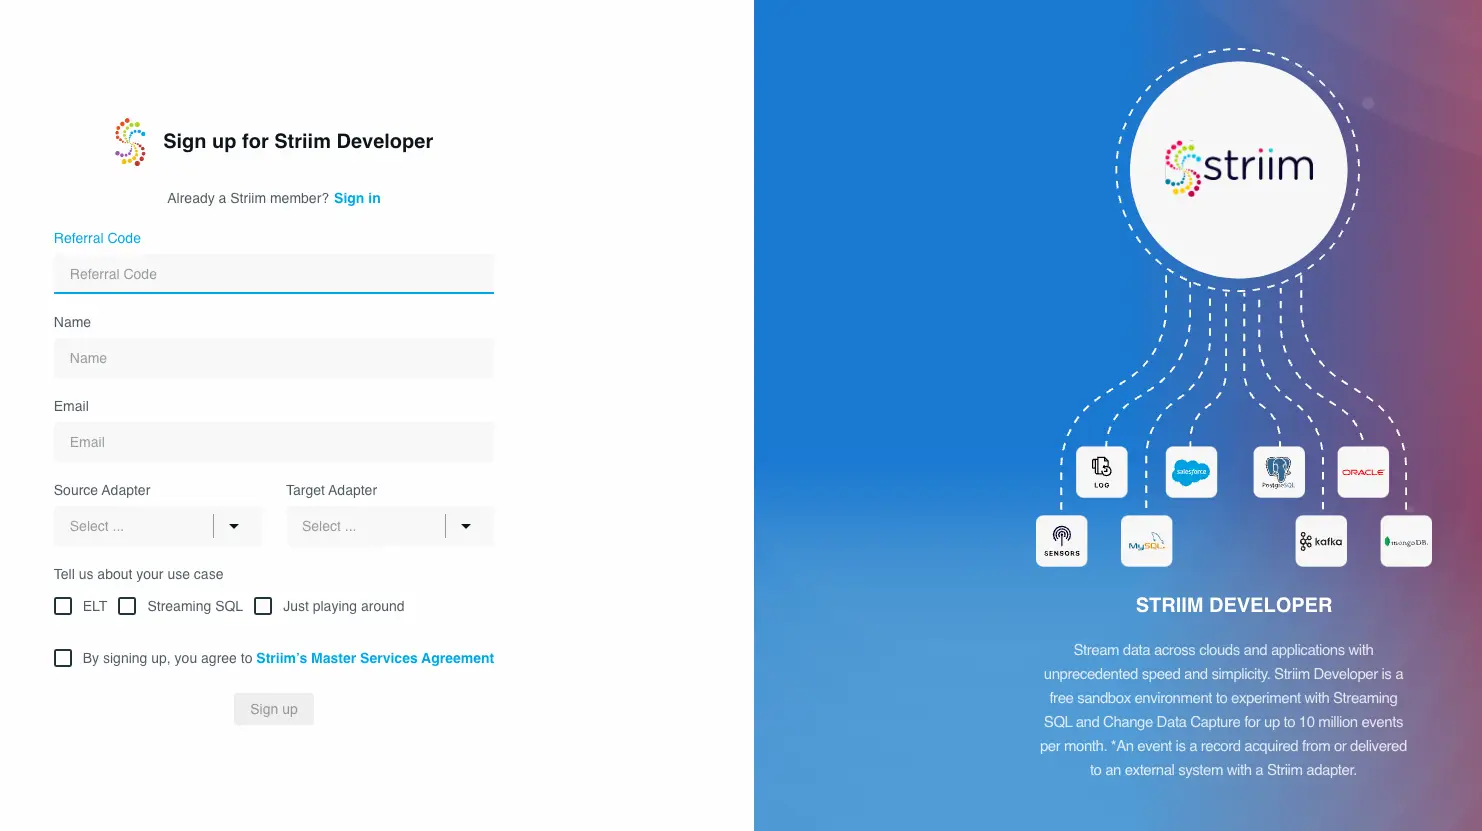
Get started on your journey with Striim by signing up for free on Striim’s Developer Edition.
Step – 2 – Create Striim Application
In Striim, App (application) is the component that holds the details of the data pipeline – source & target details, other logical components organized into one or more flows.
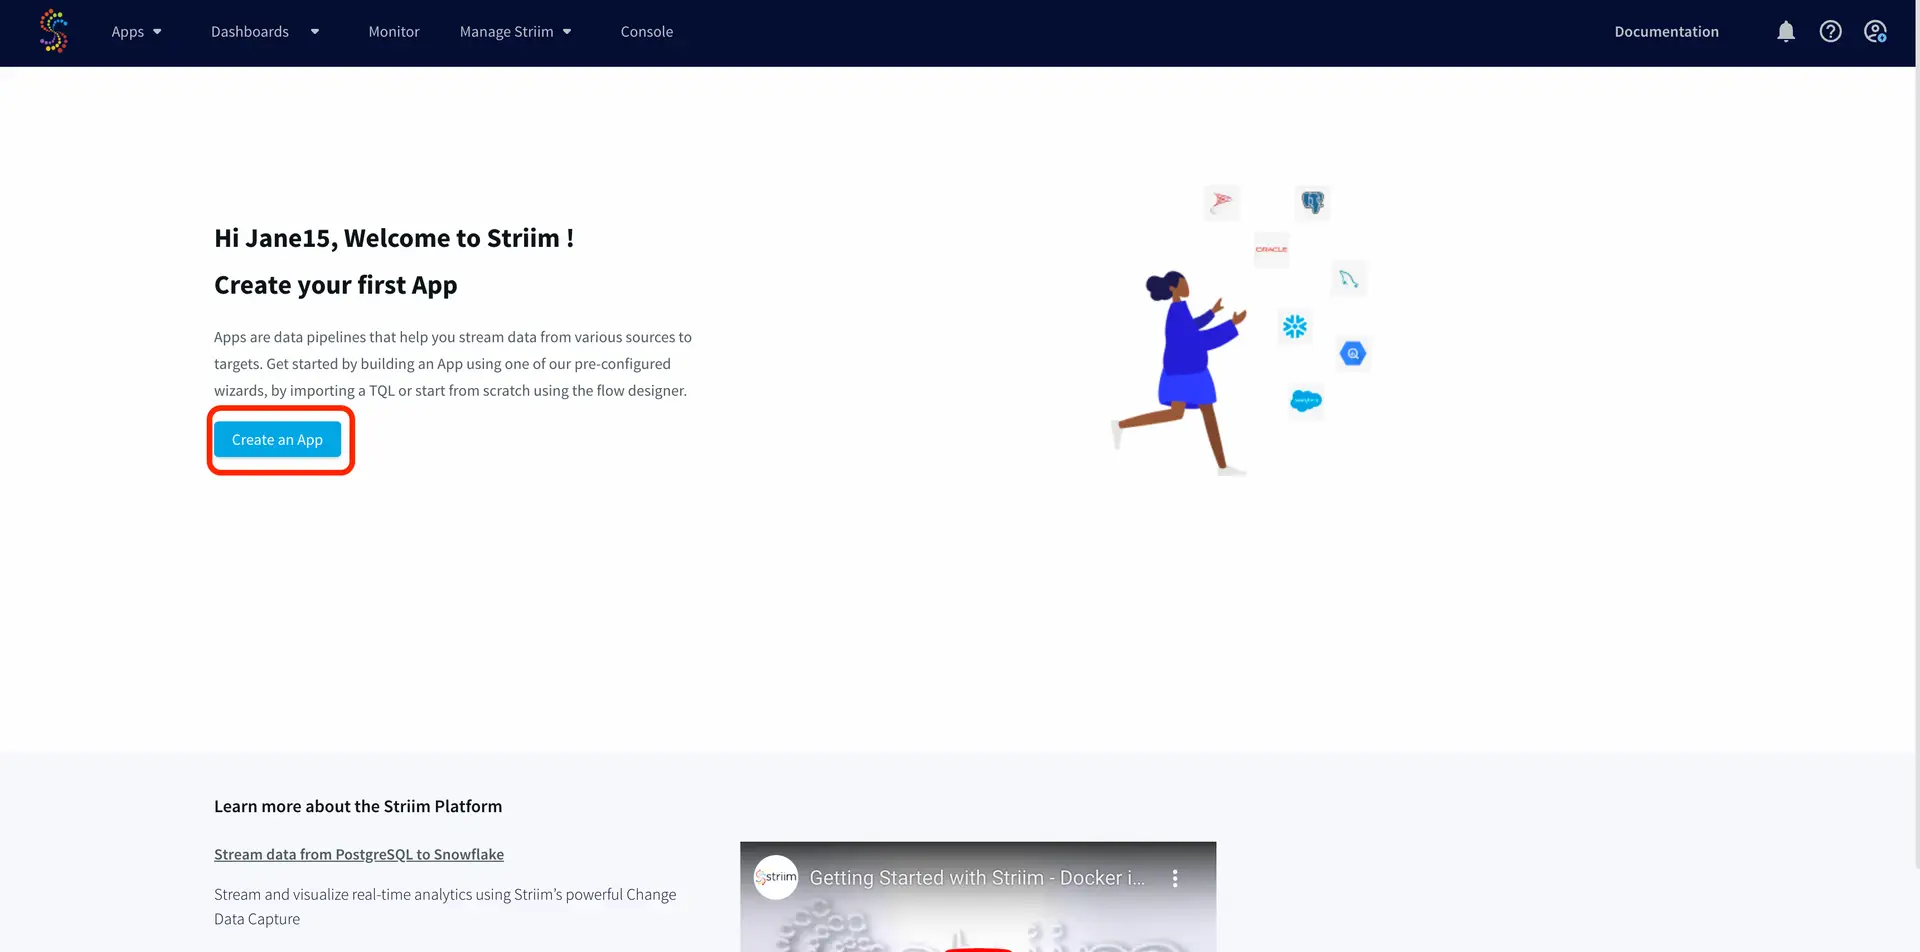
Below steps will help you create an application (refer – Screenshot-1):
Click on Apps (left-hand panel) to create your application.
Enter Source:Jira Target:BigQuery (as shown in the screenshots-1,2,3 below)
Click on the “Get Started” button.
(Screenshot- 1 – App selection based on source & target) (Screenshot- 2 – Select the Jira Reader ) (Screenshot- 3 – Target selected is BigQuery )
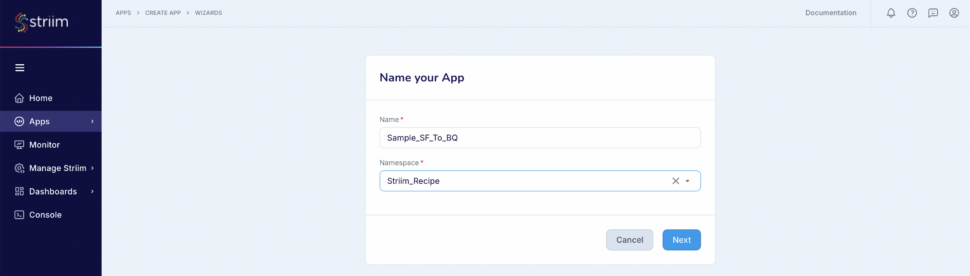
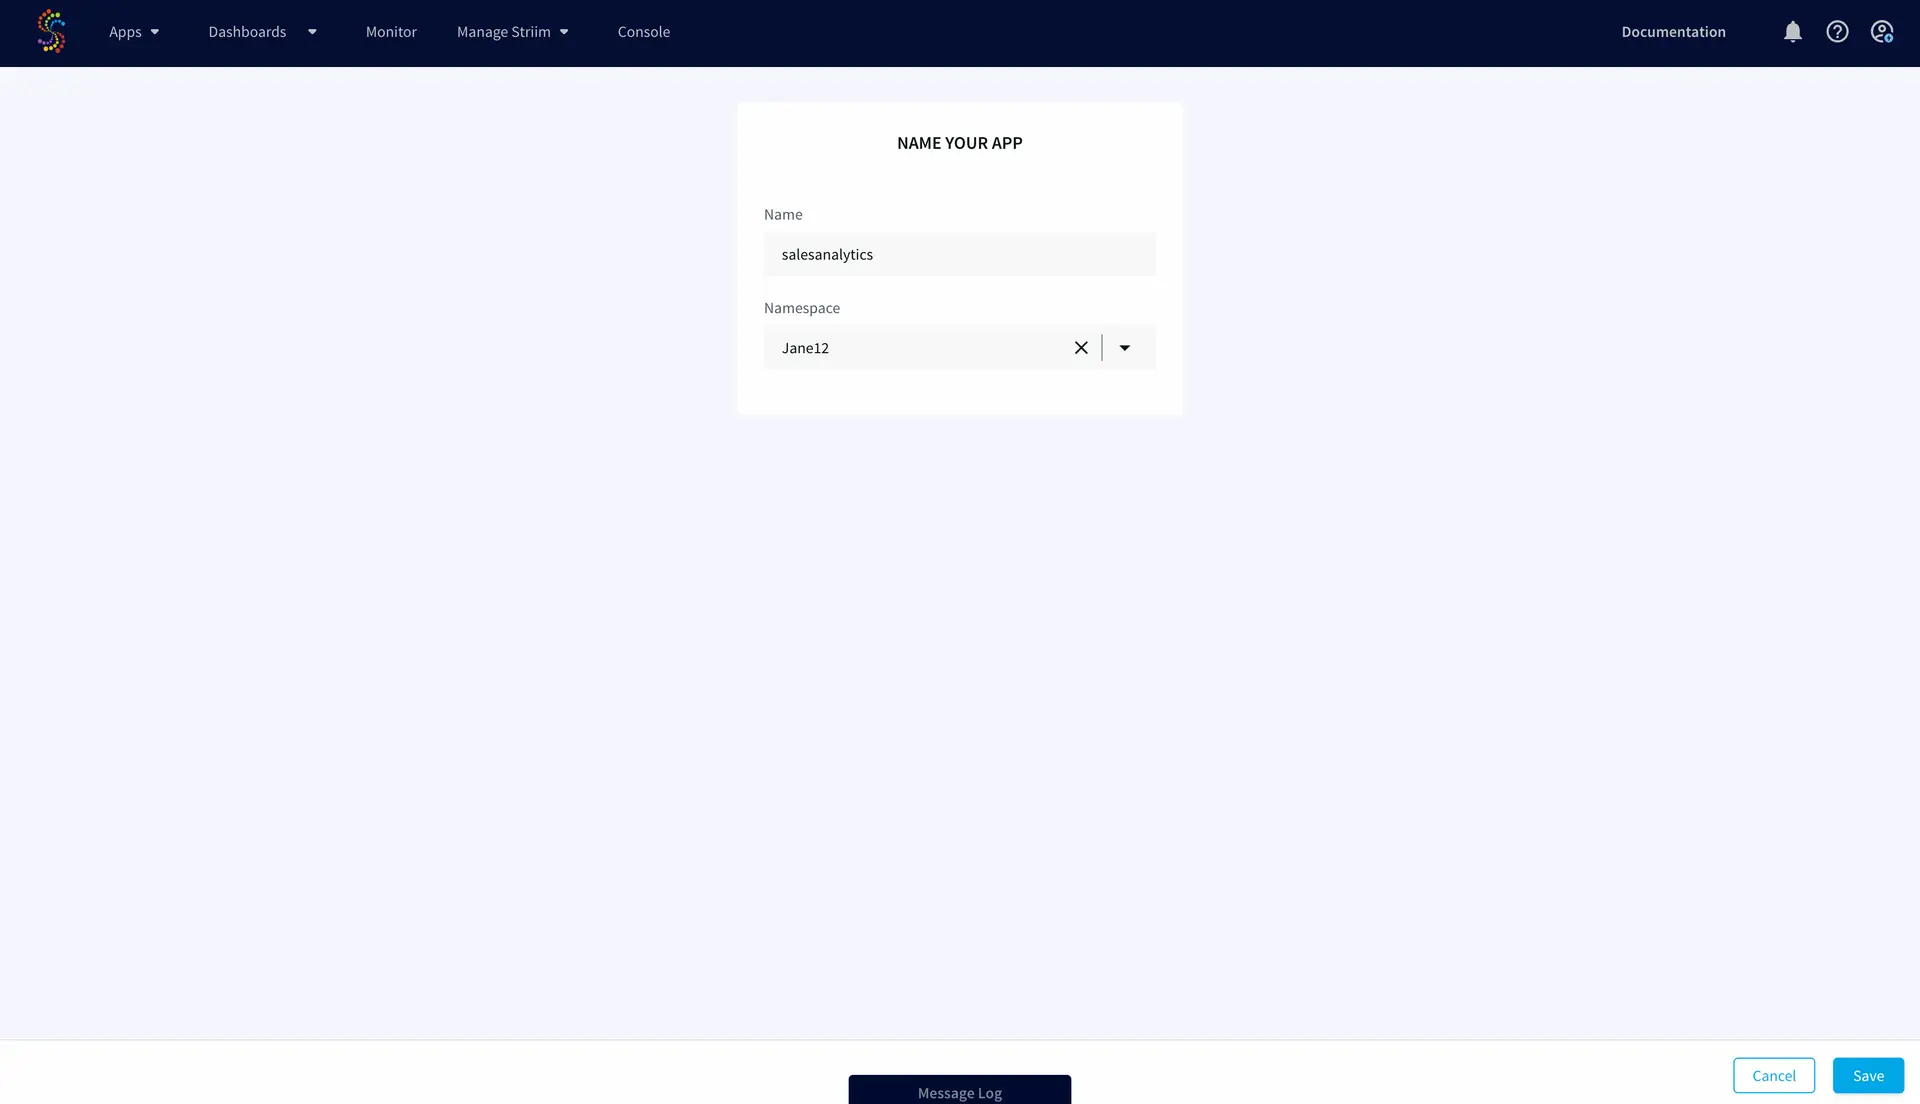
Provide a name for your application.
Select a namespace.
Click the “Next” button.
(Screenshot- 4 – Striim App Creation)
Step – 3 – Configuring Jira as Source
Before we jump into the connection to the source, lets understand Connection Profile and Target schema creation that are required for our pipeline creation.
Connection Profile – Connection profile allows you to specify the properties required to connect to an external data source once and use that set of properties in multiple sources and/or targets in multiple applications. The authentication type supported by Connection profiles is manual OAuth for Jira and ServiceAccount for Google BigQuery.
Target Schema creation – Keep this enabled to experience the power of Striim where all the required schemas and tables are created for you by Striim (if they don’t exist already). Note – Permissions are the only key requirement that you need to make sure of. For this recipe you will need to provide the service account key which is also mentioned in the next step.
In the “Configure Jira source” dialog (Screenshot-5):
Select “Authenticate using API Key”. (You can use OAuth if you have setup the client app in Jira, as mentioned in Prep work section)
Enter the “Endpoint URL”
Provide the “Username”
Paste the API token that was generated in Prep section (Point-6)
(Screenshot- 5 – Configure Jira Source)
Striim will check on the source and environment access and then enable the “Next” button. (Screenshot-6) (Screenshot- 6 – Validating Source and Checking Environment)
In the next screen, select the Jira object(s) that you want to move into BigQuery and click “Next”. (Screenshot-7) (Screenshot- 7 – Source Object selection)
Step – 4 – Configuring BigQuery as Target
Choose the service account key.
The “Project ID” will get auto-populated from the service account key. (Screenshot-8, 9)
Either select an existing data set or create a new one. For this recipe we have created a new data set.
Click on the “Next” button.
Striim will validate the target connectivity and enable the “Next” button. (Screenshot-10)
(Screenshot- 10 – Target checks and validation)
Review all the details of the data pipeline that we just created and click on “Save & Start”. (Screenshot-11) (Screenshot- 11 – Pipeline Review)
You have successfully created an app that will move your Jira data into Google BigQuery! (Screenshot- 12 – Successful App Creation)
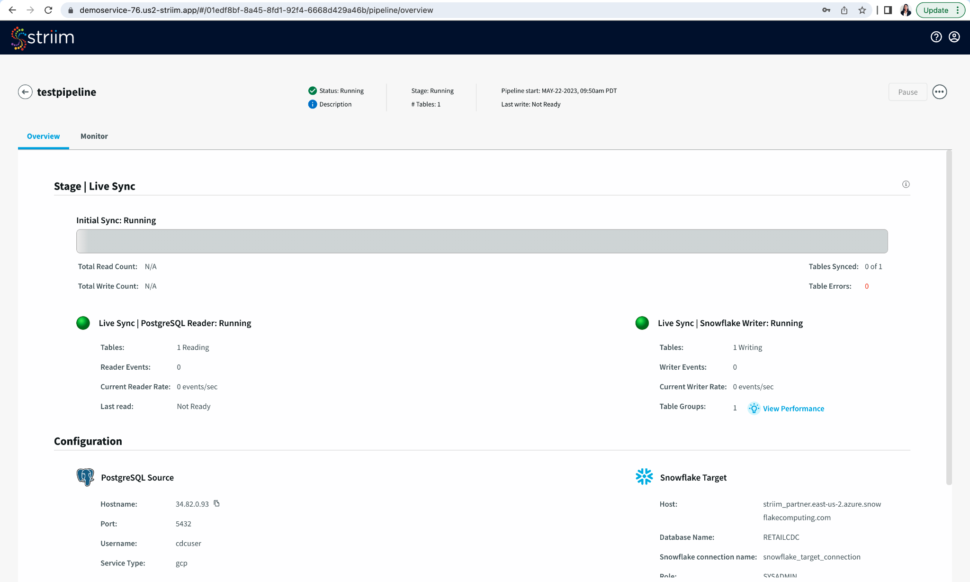
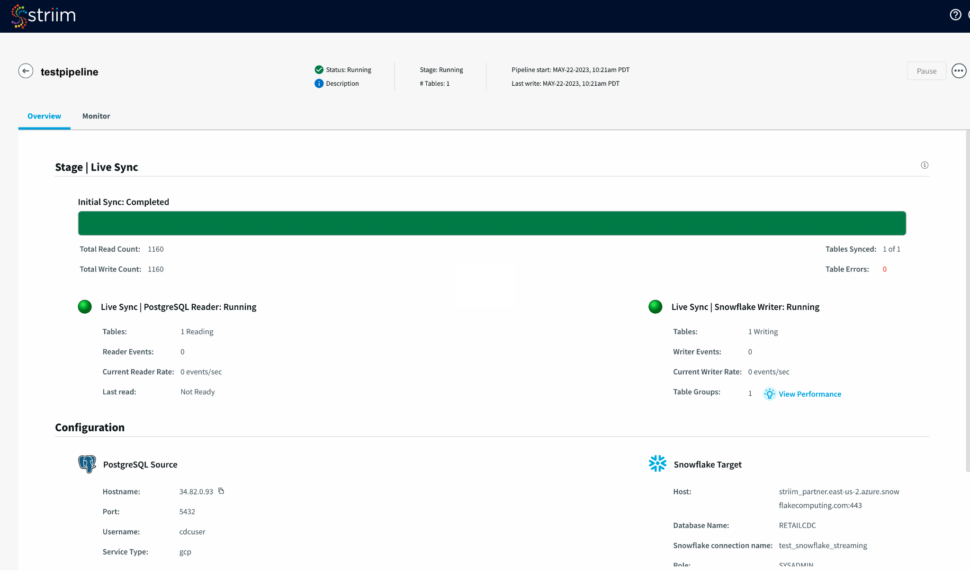
Step – 5 – Running and Monitoring your application
As the Striim App starts running,the dashboards and monitors (screenshot- 13,14) show the real-time data movement along with various metrics (ex- memory and CPU usage) that we capture. Refer to our documentation for more details on monitoring. (Screenshot- 13 – Monitoring Dashboard) (Screenshot-14 – Metrics overview)
Related Information
Apart from the wizard, you can use the sample TQL to quickly build your application.
For details on Jira properties, scopes and objects supported refer to the documentation.
Learn more about data streaming using Striim through our other Tutorials and Recipes.
More details about increasing throughput using parallel threads and recovery are here.
Conclusion
While this recipe has provided you steps to create a pipeline for your Jira data, do check all the application adapters that Striim supports to read from and write to.
If you have any questions regarding Jira adapter or any other application adapters, reach out to us at applicationadapters_support@striim.com.
This recipe shows how you can build a data pipeline to read data from ServiceNow and write to BigQuery. Striim’s ServiceNow Reader will first read the existing tables from the configured ServiceNow dataset and then write them to the target BigQuery project using the BigQuery Writer, a process called “initial load” in Striim and “historical sync” or “initial snapshot” by others. After completing the initial load, the ServiceNow Reader will automatically transition to continuously reading updates from the configured ServiceNow datasets, and then writing these source updates to the target BigQuery project using the BigQuery Writer. You can use the recipe to write to any of Striim’s supported targets.
Benefits
Striim’s unified data streaming platform empowers organizations to infuse real-time data into AI, analytics, customer experiences and operations.
Leverage Striim’s wide range of application adapters to read multiple application data and consolidate in a single data warehouse to create custom reports for enhanced analytics.
Step – 1 – Prep Work
Setting up ServiceNow as source
To generate the Client ID and Client secret properties, set up an OAuth application endpoint as directed in the ServiceNow documentation.
See Access control list rules in ServiceNow’s documentation for details on how to create access privileges for users.
For full table access, the ServiceNow user account must have the admin and snc_read_only roles.
For per-table access, the ServiceNow user account must have the sys_db_object and sys_glide_object roles at the row level and field level ACL as well as the personalize_dictionary role.
Setting up BigQuery as Target
Create an account in BigQuery where you can access the transferred data.
Get started on your journey with Striim by signing up for free on Striim’s Developer Edition.
Step – 2 – Create Striim Application
In Striim, App (application) is the component that holds the details of the data pipeline – source & target details, other logical components organized into one or more flows.
Below steps will help you create an application (refer – Screenshot-1):
Click on Apps (left-hand panel) to create your application.
Enter Source:ServiceNow Target:BigQuery (as shown in the screenshots-1,2,3 below)
Click on the “Get Started” button.(Screenshot- 1 – Create App)
(Screenshot- 2 – Select the ServiceNow Reader )
(Screenshot- 3 – Target selected is BigQuery )
Provide a name for your application
Select a namespace
Click the “Next” button(Screenshot- 4 – Striim App Creation)
Step – 3 – Configuring ServiceNow as Source
Before we jump into the connection to the source, lets understand Connection Profile and Target schema creation that are required for our pipeline creation.
Connection Profile – Connection profile allows you to specify the properties required to connect to an external data source once and use that set of properties in multiple sources and/or targets in multiple applications. The authentication types supported by Connection profiles are OAuth for ServiceNow and ServiceAccount for Google BigQuery. For ServiceNow, to generate the Client ID and Client secret properties, set up an OAuth application endpoint as directed in the ServiceNow documentation. (same as the steps given in Prep work section)
Target Schema creation – This is enabled to experience the power of Striim where all the required schemas and tables are created for you by Striim (if they don’t exist already). If you do not want the automatic target schema creation, disable it after the pipeline is created. Note – Permissions are the only key requirement that you need to make sure of. For this recipe you will need to provide the service account key which is also mentioned in the next step.
In the “New ServiceNow Connection Profile” dialog (Screenshot-6):
Connection Profile Name – provide a name to identify this connection
Namespace – Select the namespace. In this case we have used the namespace where the App is created and you can do the same.
Host – Provide the host (for example: <ddd.com>). Note: Please do not specify https:// in the host field.(Screenshot- 6 Connection Profile creation)
Click on “Sign in using OAuth”
You will be redirected to the ServiceNow login page where you click on “Allow”. (Screenshot-7)
After successfully logging in you will see the below – (Screenshot-8)(Screenshot-7- Creation of Connection Profile for ServiceNow)(Screenshot- 8 – ServiceNow account authenticated)
The Connection profile dialog should have success messages for the connection and Test. (refer Screenshot-9 below)
Click on Save.(Screenshot- 9 – Successful creation of Connection profile for Source)
Striim will check on the source and environment access and then enable the “Next” button. (Screenshot- 10 – Source connection validation)
In the next screen, select the ServiceNow object(s) that you want to move into Google BigQuery and click “Next”.(Screenshot- 11 – Source Object selection)
Step – 4 – Configuring BigQuery as Target
Choose the service account key.
The “Project ID” will get auto-populated from the service account key. (Screenshot-12, 13)(Screenshot-12 – BigQuery credential upload)
Either select an existing data set or create a new one. For this recipe we have created a new data set.
Click on “Next” button(Screenshot-13 – Target Configuration)
Striim will validate the target connectivity and enable the “Next” button.(Screenshot- 14 – Target checks and validation)
Review all the details of the data pipeline that we just created and click on “Save & Start”.(Screenshot- 15 – Pipeline Review)
You have successfully created an app that will move your ServiceNow data into Google BigQuery!
(Screenshot- 16 – Successful App Creation)
Step – 5 – Running and Monitoring your application
As the Striim App starts running,the dashboards and monitors (screenshot- 17) show the real-time data movement. Refer to our documentation for details on the metrics that are monitored for ServiceNow Reader. (Screenshot- 17 – Monitoring Dashboard)
Related Information
Use the Polling Interval property to control the incremental updates from ServiceNow data. For more real-time updates, set the value in seconds. In the above recipe, the polling interval has been set to 5s.
Learn more about data streaming using Striim through our other Tutorials and Recipes.
More details about increasing throughput using parallel threads and recovery are here.
Demo Video
Check out the recipe in action:
Conclusion
While this recipe has provided you steps to create a pipeline for your ServiceNow data, do check all the application adapters that Striim supports to read from and write to.
If you have any questions regarding ServiceNow adapter or any other application adapters reach out to us at applicationadapters_support@striim.com.
At Striim, we use our Salesforce Reader to read from our Salesforce account and write into Google BigQuery where we join data from HubSpot to create Looker reports that multiple internal teams (Sales, Customer Success and Finance) use for reporting, analysis and drive action items for their departments.
This recipe shows how you can build a data pipeline to read data from Salesforce and write to BigQuery. Striim’s Salesforce Reader will first read the existing tables from the configured Salesforce dataset and then write them to the target BigQuery project using the BigQuery Writer, a process called “initial load” in Striim and “historical sync” or “initial snapshot” by others. After completing the initial load, the Salesforce Reader will automatically transition to continuously reading updates to the configured Salesforce datasets, and then writing these source updates to the target BigQuery project using the BigQuery Writer.You can use the recipe to write into any of Striim supported targets.
Benefits
Act in Real Time – Predict, automate, and react to business events as they happen, not minutes or hours later.
Empower Your Teams – Give teams across your organization a real-time view into operational data.
Step – 1 – Prep Work
Setting up Salesforce as a source
Make sure you have the permissions to be able to access the objects in the Salesforce account that you would like to read the data from. These are the permissions that will be required for Automated OAuth:
Access the identity URL service
Manage Salesforce services
Manage user data via APIs
Perform requests at any time
Google BigQuery Target
Create an account in BigQuery where you can access the transferred data.
Get started on your journey with Striim by signing up for free on Striim’s Developer Edition.
Step – 2 – Create Striim Application
In Striim, App (application) is the component that holds the details of the data pipeline – source & target details, other logical components organized into one or more flows.
Below steps will help you create an application (refer – Screenshot-1):
Click on Apps (left-hand panel) to create your application.
Enter Source:Salesforce Target:BigQuery (as shown in the screenshots-1,2,3 below)
For this recipe, we are going to use Salesforce Reader with App type as automated (screenshot-3)
Click on “Get Started” button.
(Screenshot- 1 – App selection based on source & target)
(Screenshot- 2 – Select the Salesforce Reader (first in the list as shown below))
(Screenshot- 3 – Target selected is BigQuery and App type should be “Automated”)
Provide a name for your application
Create a new namespace
Click the “Next” button
(Screenshot- 4 – Striim App Creation)
Step – 3 – Configuring Salesforce as Source
Before we jump into the connection to the source, lets understand Connection Profile and Target schema creation that are required for our pipeline creation.
Connection Profile – Connection profile allows you to specify the properties required to connect to an external data source once and use that set of properties in multiple sources and/or targets in multiple applications. The authentication types supported by Connection profiles are OAuth for Salesforce and ServiceAccount for Big Query.
Target Schema creation – Keep this enabled to experience the power of Striim where all the required schemas and tables are created for you by Striim (if they don’t exist already). Note – Permissions are the only key requirement that you need to make sure of. For this recipe you will need to provide the service account key which is also mentioned in the next step.
(Screenshot- 5 Gathering source details to connect)
Enable “Use Connection Profile”
(Screenshot- 6 – Connection Profile creation)
In the “New Salesforce Connection Profile” dialog:
Connection Profile Name – provide a name to identify this connection
Namespace – Select the namespace. In this case we have used the namespace where the App is created and you can do the same.
Host – We are connecting to the Prod instance and hence it is not required. If you are connecting to a non-prod account like sandbox, then provide the host (for example: striim–ferecipe.sandbox.my.salesforce.com ). Note: Please do not specify https:// in the host field.
(Screenshot-7- Creation of Connection Profile for Salesforce)
Click on “Sign in using OAuth”
You will be redirected to the Salesforce login page where you can provide your credentials.
After successfully logging in you will see the below – screenshot-8
The Connection profile dialog should have success messages for the connection and Test. (refer Screenshot-9 below)
Click on Save.
(Screenshot- 9 – Successful creation of Connection profile for Source)
Striim will check on the source and environment access and then enable the “Next” button.
In the next screen, select the Salesforce object(s) that you want to move into Big Query and click “Next”.
(Screenshot- 10 – Source Object selection)
Step – 4 – Configuring BigQuery as Target
Choose the service account key.
The “Project ID” will get auto-populated from the service account key. (Screenshot-11, 12)
(Screenshot-11 – BigQuery credential upload)
Either select an existing data set or create a new one. For this recipe we have created a new data set.
Click on “Next” button
(Screenshot-12 – Target Configuration)
Striim will validate the target connectivity and enable the “Next” button.
(Screenshot- 13 – Target checks and validation)
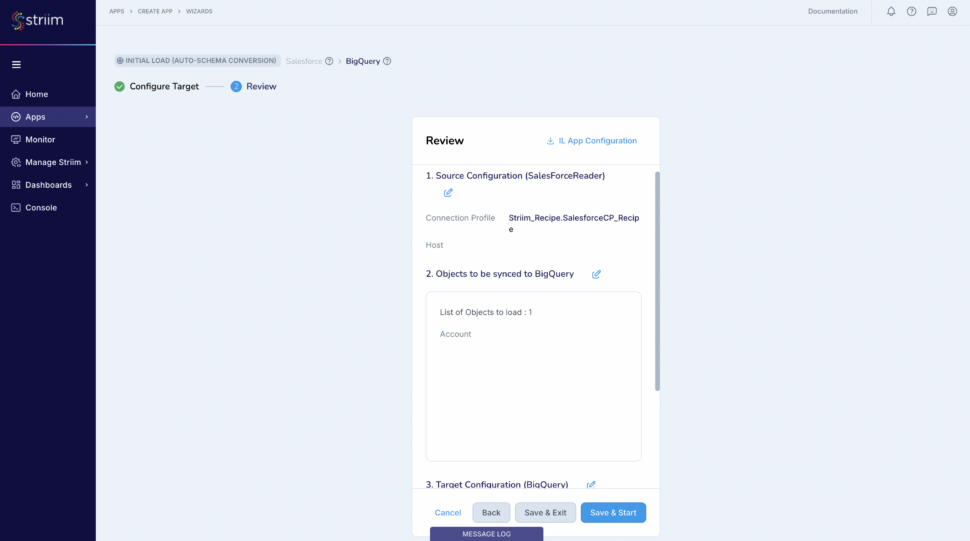
Review all the details of the data pipeline that we just created and click on “Save & Start”.
(Screenshot- 14 – Pipeline Review)
You have successfully created an app that will move your Salesforce data into Google BigQuery!
(Screenshot- 15 – Successful App Creation)
Step – 5 – Running and Monitoring your application
As the Striim App starts running,the dashboards and monitors (screenshot- 16,17) show the real-time data movement along with various metrics (ex- memory and CPU usage) that we capture. Refer to our documentation for more details on monitoring.
(Screenshot- 16 – Monitoring Dashboard)
(Screenshot-17 – Metrics overview)
In the application that we just created you will be able to experience the real-time data movement into the target thereby being able to predict, automate, and react to business events as they happen, not minutes or hours later. The data from Big Query is then joined with our Hubspot data to create Looker reports.
Related Information
In addition to the Salesforce Reader, Striim offers other Salesforce related adapters – Salesforce CDC, Salesforce Writer, Salesforce Pardot, Salesforce Platform Event Reader and Salesforce Push Topic Reader.
You can also look into another Salesforce recipe where we read from Salesforce and write into Azure Synapse.
Learn more about data streaming using Striim through our other Tutorials and Recipes.
More details about increasing throughput using parallel threads and recovery are here.
Conclusion
While this recipe has provided you steps to create a pipeline for your Salesforce data, do check all the application adapters that Striim supports to read from and write to.
Improve efficiency, patient care, and resource allocation with real-time data
Benefits
Real-Time Monitoring
Process incoming ER data in real-time for immediate triage and resource allocation
Enhanced Decision-Making Make informed decisions through visual dashboards that represents key metrics and KPIs
Efficient Communication
Streaming analytics facilitate communication among healthcare teams as well as with patients for better collaboration
On this page
Healthcare Needs Real-Time Data
In the dynamic landscape of healthcare, the demand for real-time data in emergency room operations has become increasingly important. Hospital emergency rooms serve as critical hubs for patient care, responding to a myriad of medical crises with urgency and precision. The ability to monitor and analyze real-time data within these environments is critical for enhancing operational efficiency, optimizing resource allocation, and ultimately improving patient outcomes.
As healthcare professionals navigate the complexities of emergency room settings, a comprehensive understanding of real-time data through intuitive dashboards becomes indispensable.
This tutorial aims to show the significance of healthcare monitoring through a real-time data dashboard, providing insights into how these tools can revolutionize emergency room management, streamline workflows, and contribute to a more responsive and patient-centric healthcare system. Whether it’s tracking patient flow, resource utilization, or anticipating surges in demand, the integration of real-time data dashboards empowers healthcare providers to make informed decisions swiftly and proactively in the ever-evolving landscape of emergency care.
Why Striim for Healthcare?
Striim offers a straightforward, unified data integration and streaming platform that combines change data capture (CDC), Streaming SQL and real-time analytical dashboards as a fully managed service.The Continuous Query (CQ) component of Striim uses SQL-like operations to query streaming data with almost no latency.
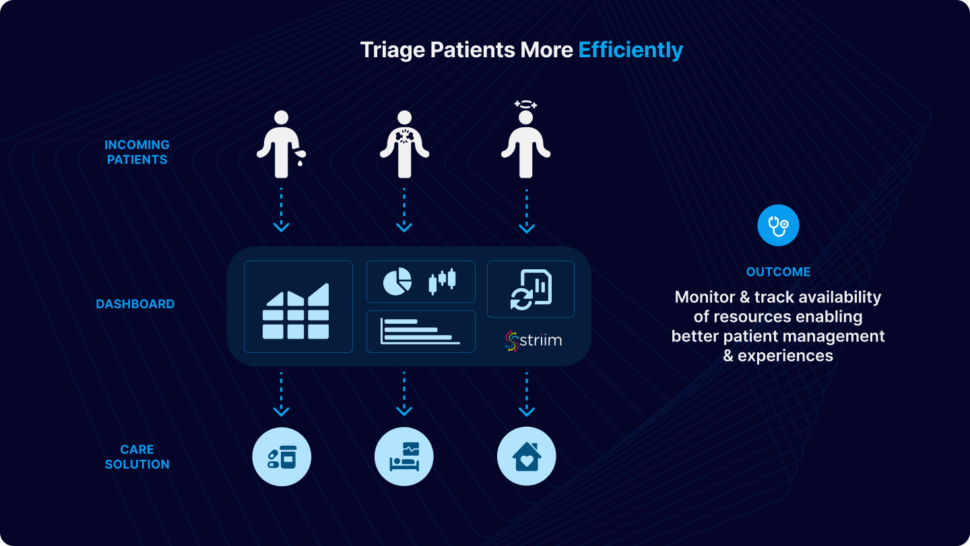
Using streaming analytics and real-time dashboards for Emergency Room (ER) monitoring processes incoming patient data in real-time, allowing for immediate triage and prioritization of patients based on the severity of their conditions. Hospitals can monitor the availability of resources such as beds, medical staff, and equipment in real-time. This allows for efficient allocation and utilization of resources. Dashboards provide a visual representation of key metrics and KPIs. Healthcare professionals can make informed decisions quickly by accessing real-time data on patient statuses, resource utilization, and overall ER operations.
Use-Case
In this particular use case, patient’s data from their ER visit is continuously streamed in real-time, undergoing dynamic filtering and processing. Cache files, containing essential details such as hospital information, provider details, and patient data, are employed to enhance and integrate the data stream. The resulting processed data is utilized for immediate analytics through the use of dashboards and elastic storage.
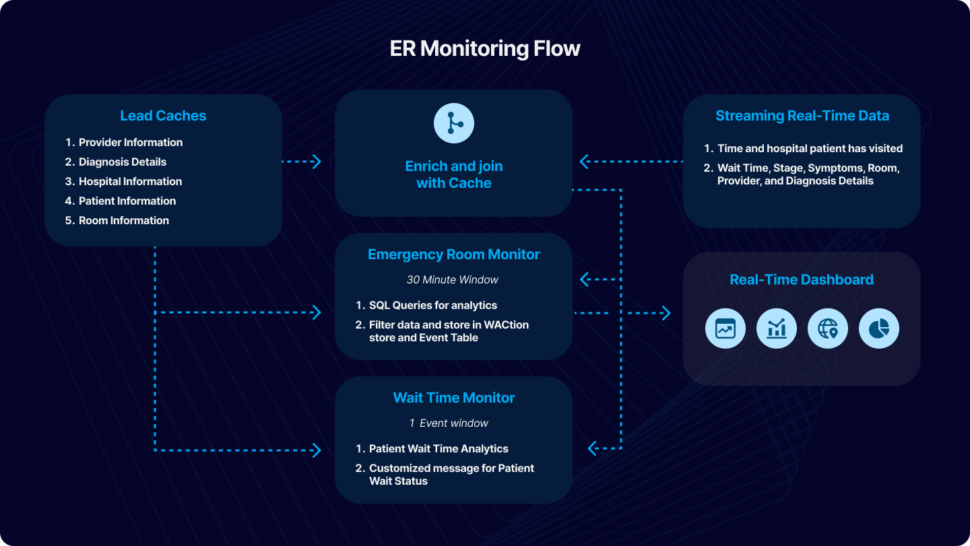
For the purpose of this tutorial, we have simulated fictional data in CSV format to emulate a real-world scenario. The data can be streamed from diverse sources and databases supported by Striim. This application tutorial is built from four primary sections: Loading Cache, Reading and Enriching Real-Time Data Stream, Emergency Room (ER) Monitoring, and Wait Time Monitoring.
The incoming data includes fields such as Timestamp, hospital ID, wait time, stage, symptoms, room ID, provider ID, and diagnosis details. The initial step involves enriching the data using cache, which includes adding details like hospital name, geographical location, patient name, patient age, and patient location. The enriched data is subsequently merged with other cache files, encompassing room details, provider details, and diagnosis. An outer join is executed to accommodate potential null values in these columns.
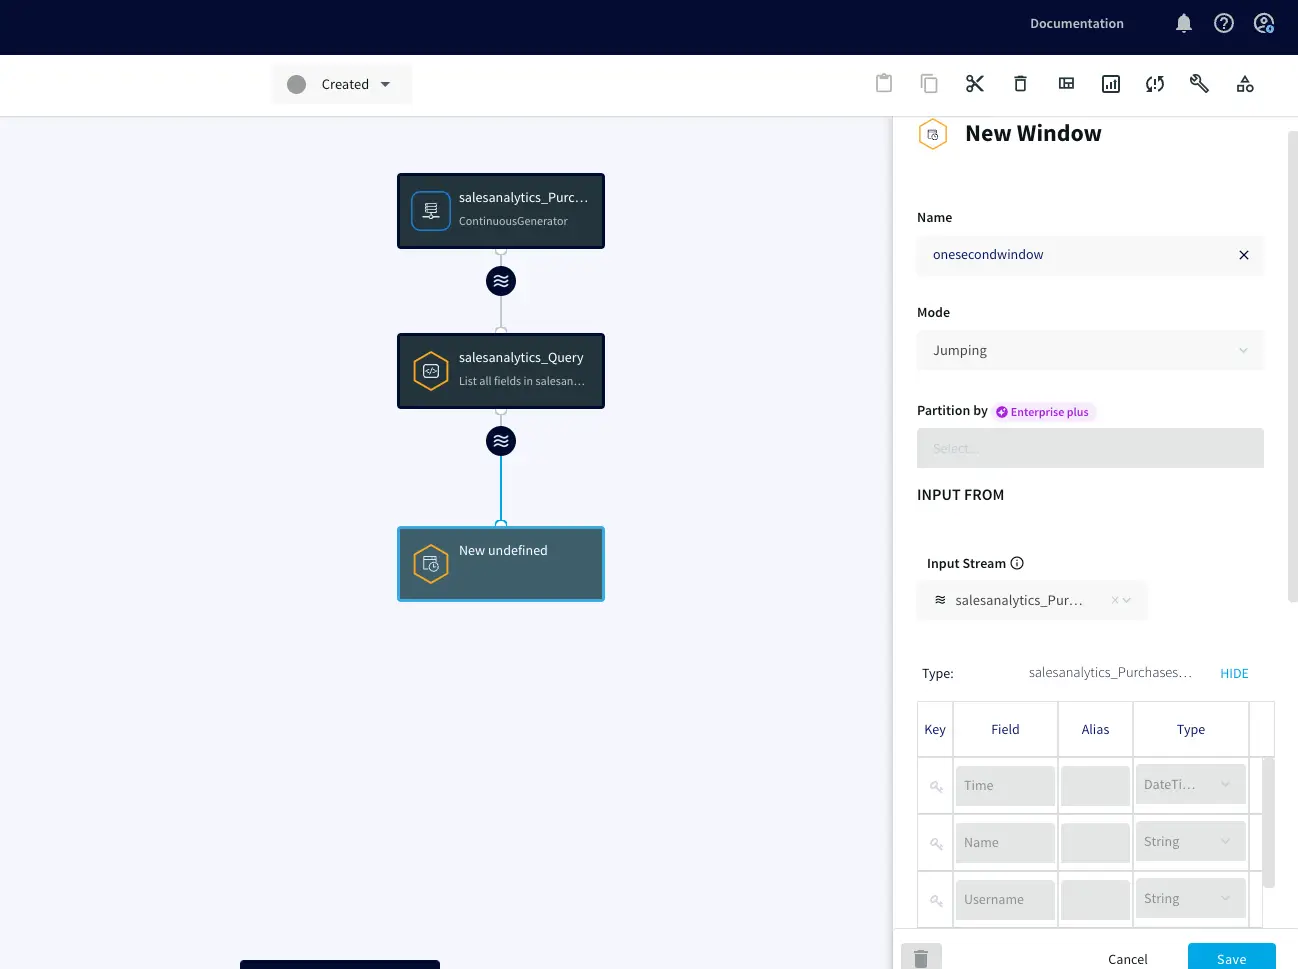
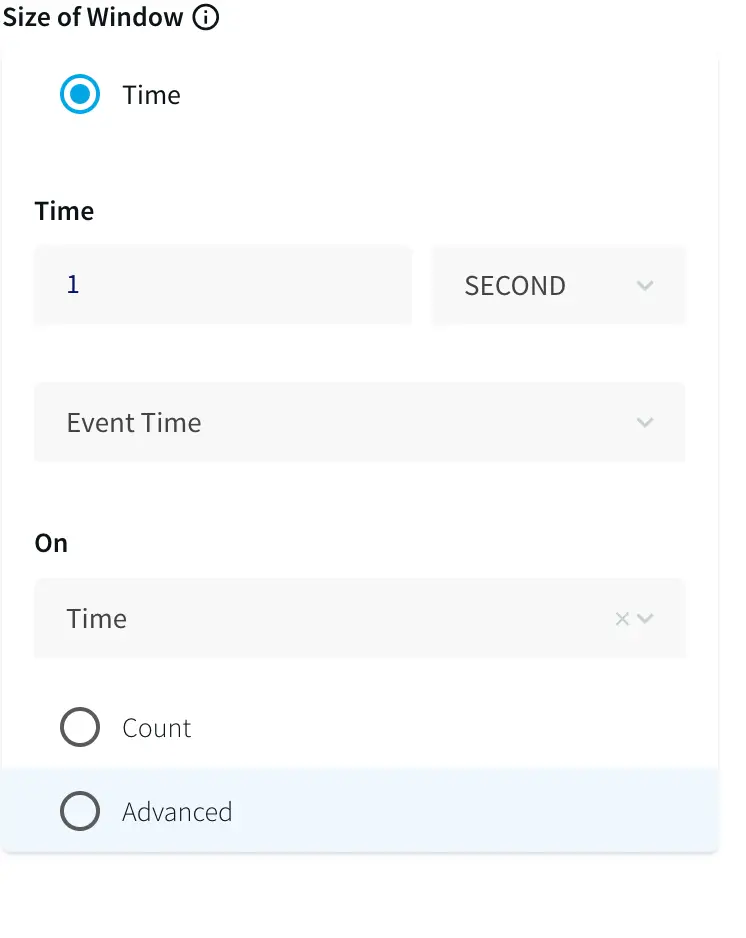
Once the data is enhanced by incorporating information from the cache, ER Monitoring takes place within a 30-minute window. A window component in Striim bounds real-time data based on time (e.g., five minutes), event count (e.g., 10,000 events), or a combination of both. Complex SQL-like queries, known as Continuous Queries (CQ), transform the data for various analytics and reporting objectives. Processed data from each stream is stored in an Event Table for real-time access and a WAction store for historical records. Event tables are queried to construct a Striim dashboard for reporting purposes. We will take a detailed look at the various components of the Striim application in this tutorial.
Wait Time Monitoring is implemented to generate personalized messages for patients, notifying them about the estimated wait time. In a real-world scenario, these messages could be disseminated through text or email alerts. To give this app a try, please download the TQL file, dashboard and the associated CSV files from our github repository. You can directly upload and run the TQL file by making a few changes discussed in the later sections.
Core Striim Components
File Reader: Reads files from disk using a compatible parser.
Cache: A memory-based cache of non-real-time historical or reference data acquired from an external source, such as a static file of postal codes and geographic data used to display data on dashboard maps, or a database table containing historical averages used to determine when to send alerts. If the source is updated regularly, the cache can be set to refresh the data at an appropriate interval.
Stream: A stream passes one component’s output to one or more other components. For example, a simple flow that only writes to a file might have this sequence
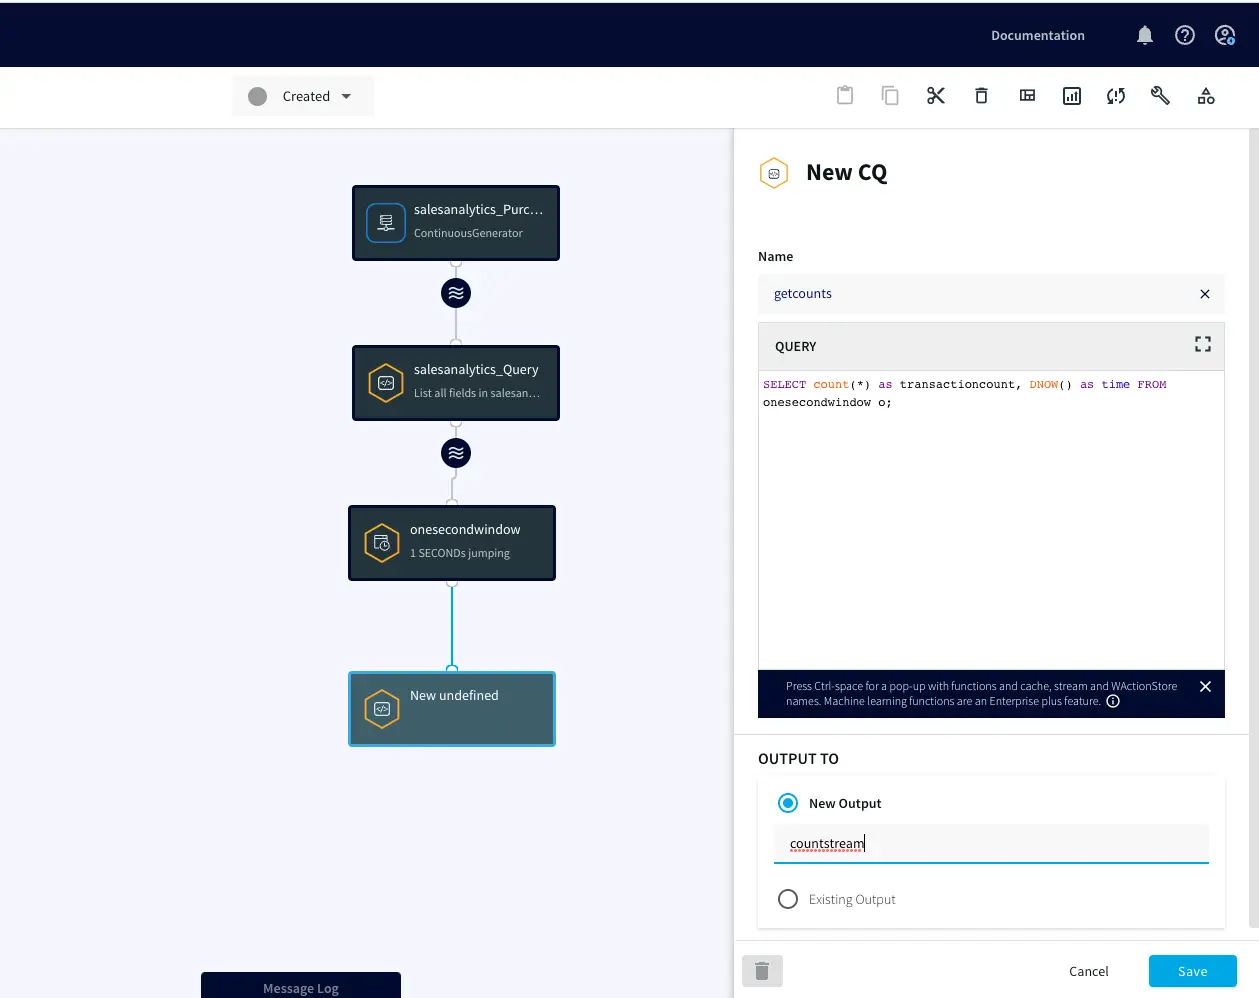
Continuous Query: Striim Continuous queries are continually running SQL queries that act on real-time data and may be used to filter, aggregate, join, enrich, and transform events.
Window: A window bounds real-time data by time, event count or both. A window is required for an application to aggregate or perform calculations on data, populate the dashboard, or send alerts when conditions deviate from normal parameters.
WAction and WActionStore: A WActionStore stores event data from one or more sources based on criteria defined in one or more queries. These events may be related using common key fields.
Event Table: An event table is similar to a cache, except it is populated by an input stream instead of by an external file or database. CQs can both INSERT INTO and SELECT FROM an event table.
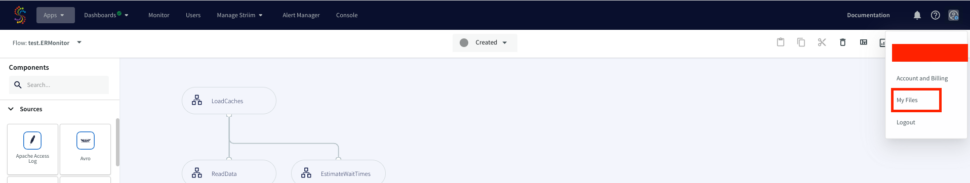
Choose ‘My files’ from the drop-down on the upper right corner and upload the cache files that you have downloaded from the github repository.
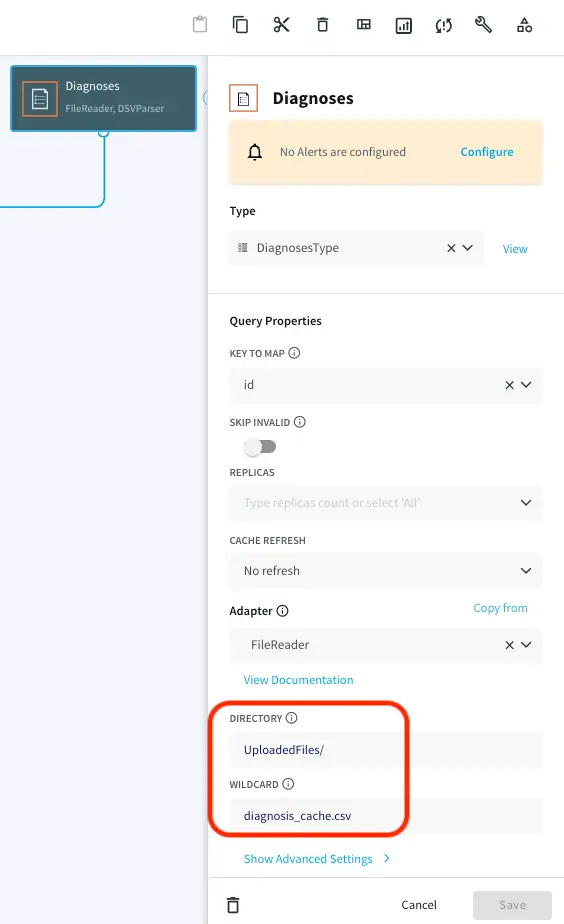
Note the path of the file and make necessary changes as shown below. Repeat this for all the five caches.
Streaming Real-Time Data
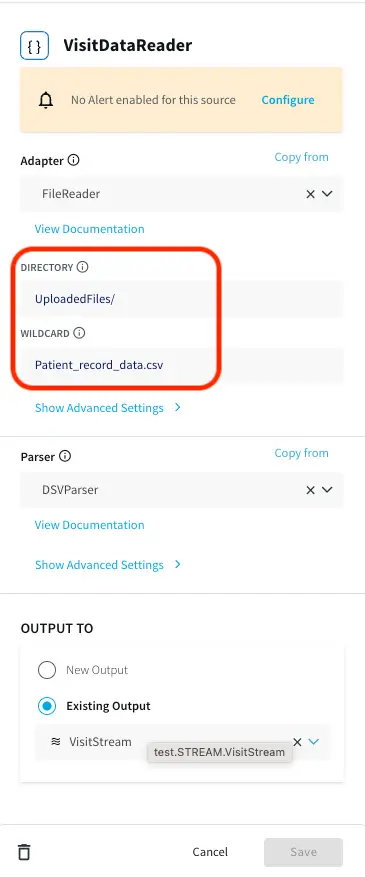
A CSV file containing patient visit data with timestamp is provided on the github repository. Upload the file in the same way as you uploaded the cache files in the previous section. Note the path of directory and edit the filereader component that reads the data as shown below:
Three Continuous Queries (CQ), ParseVisitData, EnrichVisitData and AddOuterJoinsToVisitData are applied to parse the real-time data and enrich and join with cache. The queries are provided in the TQL file. The processed data is input into ER Monitor as well as Wait Time Monitor for further analytics.
Emergency Room Monitor
The data containing Timestamp, hourOfDay, patientID, hospitalId, stage, symptoms, visitDuration, stageDuration, roomId, providerId, diagnosisCode, hospitalName, hospitalLat, hospitalLon, patientAge, patientlat, patientlon, roomName, roomType, providerLastName, providerType and diagnosis is passed through a 30 min window based on timestamp column and following analytics are performed:
DiagnosisAnalytics
HandleAlerts
HospitalAnalytics
OccupancyAnalytics
PreviousVisitAnalytics
VisitsAnalytics
WaitTimeStatsAnalytics
We will briefly look at each of the analyses in the following section. The TQL file contains every query and can be run directly to visualize the apps and dashboard.
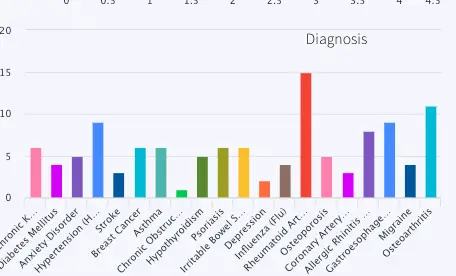
DiagnosisAnalytics: Number of patients for each type of diagnosis in the last 30 minutes is calculated. The data is visualized using a bar chart in the final dashboard. The name of the WAction store and Event table for the processed data are DiagnosisHistory and DiagnosisCountCurrent respectively. The query reading data for the bar chart is PreviousVisitsByDiagnosis.
HandleAlerts: This analysis uses a Continuous Query to assign wait status as ‘normal’, ‘medium’ and ‘high’. It also generates alerts if the wait time does not improve in 30 minutes. The alert messages are:
Case 1: If wait time improves: Hospital <hospital name> wait time of <last wait time> minutes is back to acceptable was <first wait time>
Case 2: If wait time worsens: Hospital <hospital name> wait time of <last wait time> minutes is too high was <first wait time> with <number of patients> current visits
The alert is sent to a Alert Adapter component named SendHospitalWebAlerts
HospitalAnalytics: Calculates number of visits and waitstatus based on maximum wait-time in each hospital. The geographical information of each hospital is used to color code ‘normal’, ‘medium’ and ‘high’ wait status in the map. The event table and WAction Store where the outcoming data is stored are VisitsByHospitalCurrent and VisitsByHospitalHistory respectively.
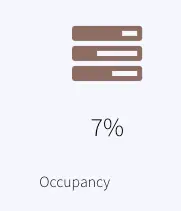
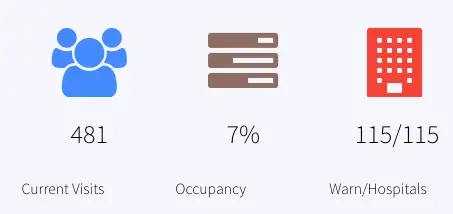
OccupancyAnalytics: Calculate the percentage of occupied rooms from a 30 mins window. The current data is stored in the event table, OccupancyCurrent. The percentage is reported as Occupancy in the dashboard.
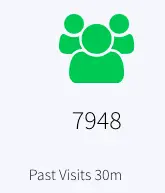
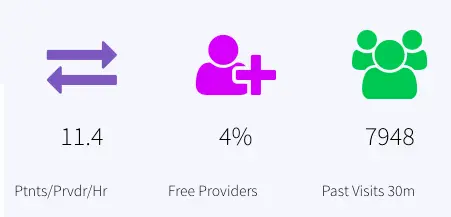
PreviousVisitAnalytics: Number of previous visits that are now Discharged, Admitted or have left in the past 30 mins are calculated. The resulting data is stored in the event table, PreviousVisitCountCurrent and WAction store PreviousVisitCountHistory. The dashboard reports ‘Past Visits 30m’ to show the previous visit count.
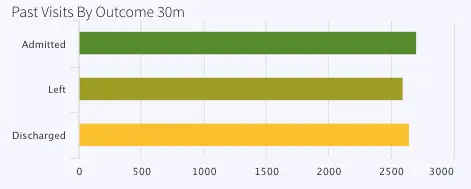
Another CQ queries the number of previous visits by stage (admitted, discharged or left) and stores current data inside event table, PreviousVisitsByStageCurrent and historical data inside WAction store, PreviousVisitsByStageHistory.
The bar chart titled ‘Past Visits By Outcome 30m’ represents this data.
VisitsAnalytics: Calculates the current visit number from the 30 min window and also the number of visits by stage.
The number of current visits is stored in the event table VisitCountCurrent and historical data is stored in the WAction store VisitCountHistory. In the dashboard the current count is reported under ‘Current Visits’
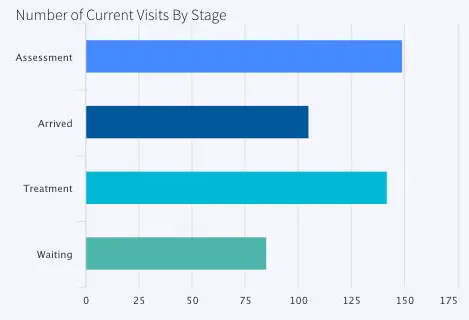
The number of visits by stage (Arrived, Waiting, Assessment or Treatment is also calculated and stored in VisitsByStageCurrent (event table) and VisitsByStageHistory (WAction Store). The data is labeled as ‘Number of Current Visits By Stage’ in the dashboard.
WaitTimeStatsAnalytics: For stage ‘waiting’, the minimum, maximum and average wait time is calculated and stored in WaitTimeStatsCurrent (Event Table) and WaitTimeStatsHistory (WAction Store).
All data from the 30 min window is saved in the event table CurrentVisitStatus. Provider analytics is done by querying this event table and joining with cache, ‘Providers’. The data is reported in the dashboard as ‘Ptnts/Prvdr/Hr’ and ‘Free Providers’
Wait Time Monitor
A jumping window streams one event at a time partitioned by patient ID and Hospital ID. The number of patients ahead of each event is calculated.
Based on the number of patients ahead, a customized message with estimated wait time information is generated
Eg: “<Patient name>, you are <1st/2nd/3rd or nth> in line at <hospital name> with an estimated <duration> wait time
The patient messages are stored in WACtion store PatientWaitMessages
Dashboards
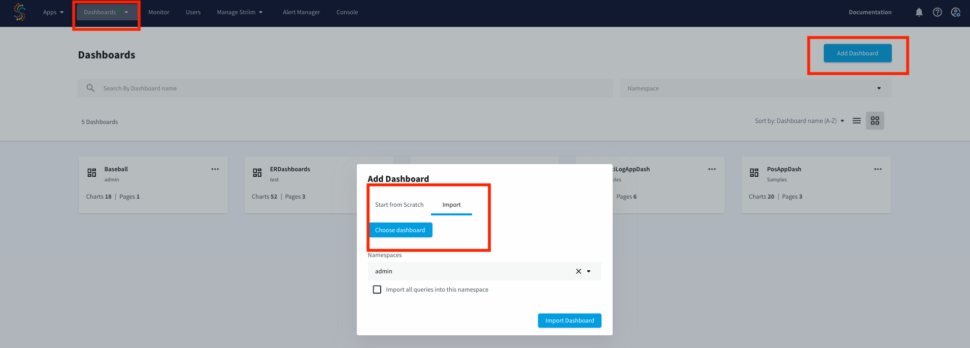
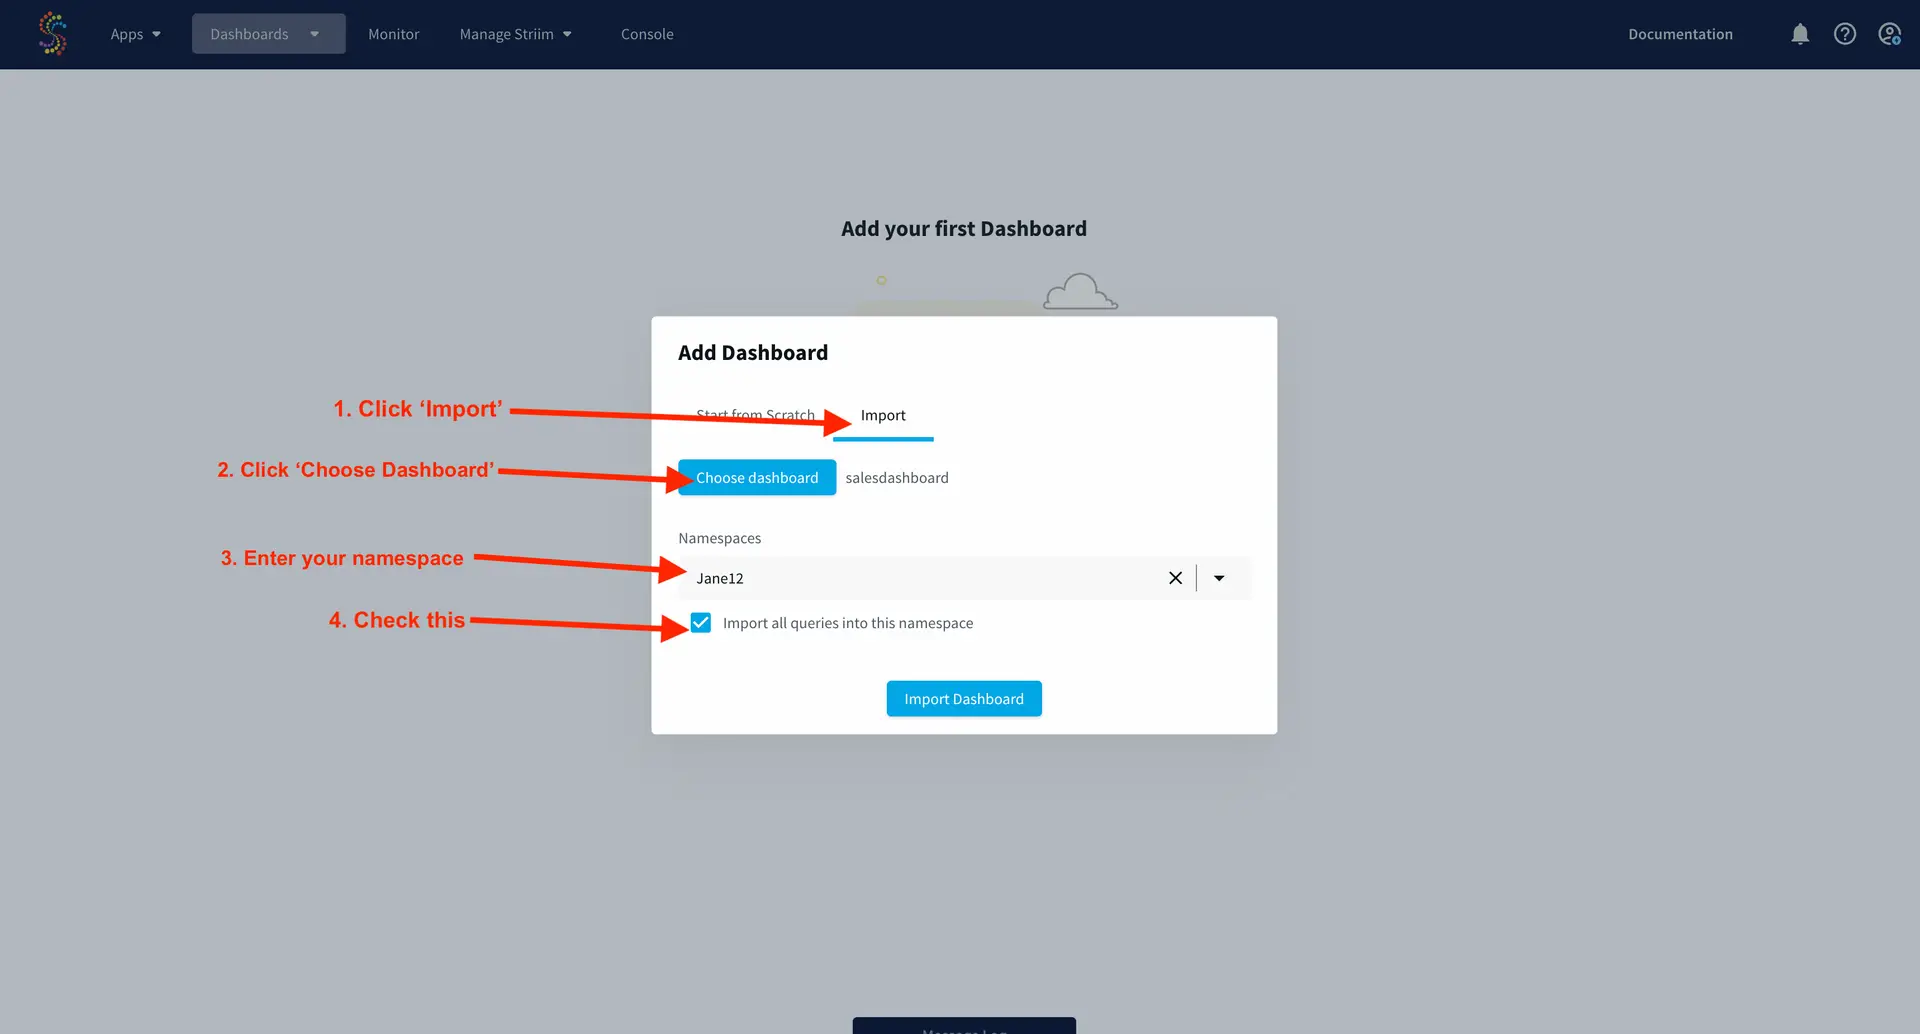
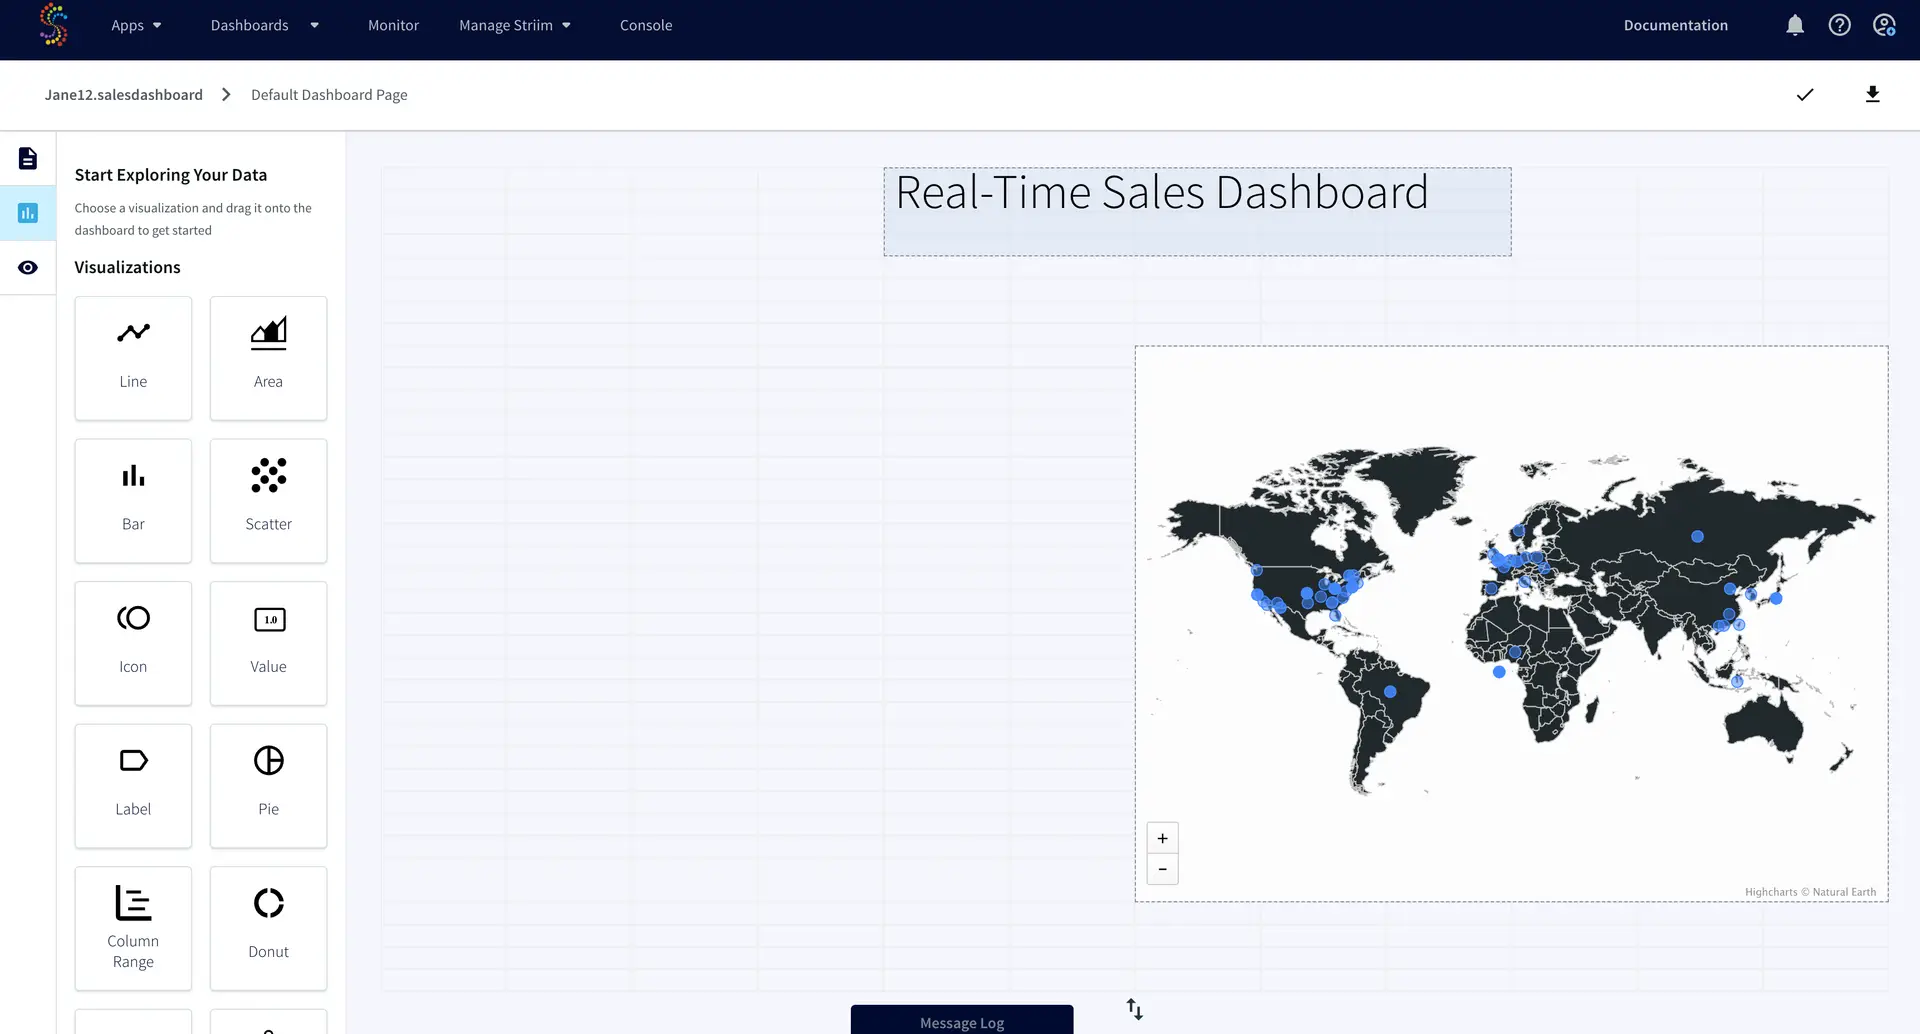
Striim offers UI dashboards that can be used for reporting. The dashboard JSON file provided in our repo can be imported for visualization of ER monitor data in this tutorial. Import the raw JSON file from your computer, as shown below:
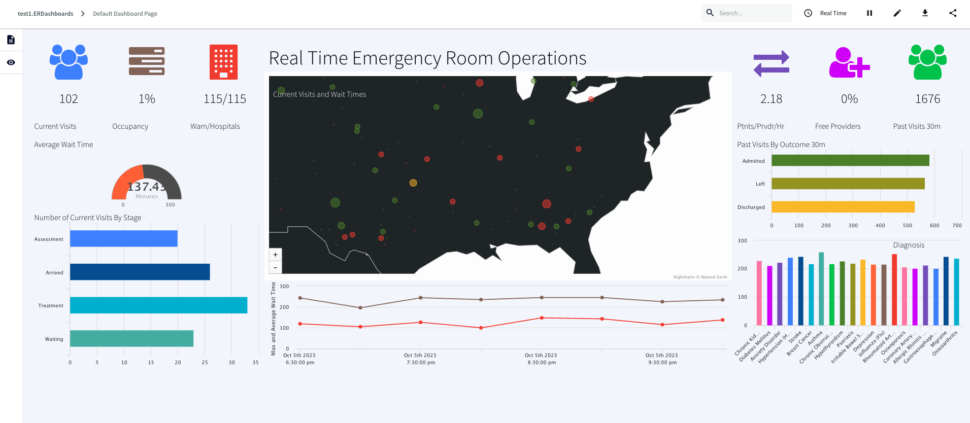
Here is a consolidated list of charts from the ER monitoring dashboard:
ActiveVisits: Number of patients that are in any other stage but “Arrived”, “Waiting”, “Assessment” or “Treatment” every 30 mins labeled as Current Visits Queries on: VisitCountCurrent
RoomOccupancy:Percentage of rooms occupied in each 30 mins window labeled as Occupancy, Queries Event Table: OccupancyCurrent
HospitalsWithHighWaits: Number of hospital with max wait status > 45 minutes/number of hospitals with wait, labeled as Warn/Hospitals, Queries event table: CurrentVisitStatus
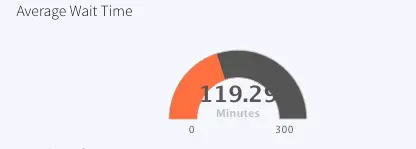
ActiveVisitWaitTime: Average wait time of all hospitals, labeled as Average Wait Time , Queries event table: WaitTimeStatsCurrent
VisitsByStage: Number of Visits for Assessment, Arrived, Treatment and Waiting at each timestamp, labeled as Number of Current Visits By Stage, Queries event table: VisitsByStageCurrent
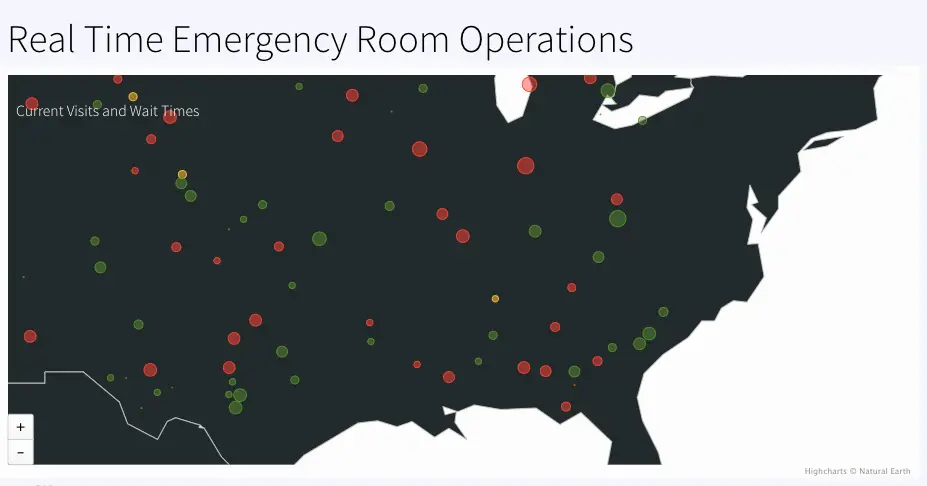
GetCurrentVisitsPerHospital: Number of visits every hospital (not ‘Discharged’, ‘Admitted’, ‘Left’) every 30 mins, labeled as, Real Time Emergency Room Operations , Queries event table: VisitsByHospitalCurrent
VisitDurationOverTime: Maximum wait time every 2 hours, labeled as Maximum Wait Time, Queries event table: WaitTimeStatsHistory
PatientsPerProvider: Patients/provider/hr, labeled as Ptnts/Prvdr/Hr, Queries event table: CurrentVisitStatus
FreeProvider: Total provider(queries: Cache Providers)- provider that are busy (queries: CurrentVisitStatus), calculate percent, labeled as Free Providers
PreviousVisits: Count of Discharged, Admitted, Left from 30 mins window, labeled Past Visits 30m, Queries event table: PreviousVisitCountCurrent
PreviousVisitsByOutcome: Number of Admitted, Left or Discharged in past 30 mins, labeled: Past Visits By Outcome 30m , Queries event table: PreviousVisitsByStageCurrent
PreviousVisitsByDiagnosis: Number of Diagnosis for each disorder in past 30 mins, labeled: Diagnosis, Queries event table: DiagnosisCountCurrent
Conclusion: Reimagine Healthcare Monitoring Leveraging Real-Time Data and Dashboards with Striim
In this tutorial, you have seen and created an Emergency Room (ER) monitoring analytics dashboard powered by Striim. This use case can be leveraged in many other scenarios in healthcare, such as pharmacy order monitoring and distribution.
Unlock the true potential of your data with Striim. Don’t miss out—start your 14-day free trial today and experience the future of data integration firsthand. To give what you saw in this recipe a try, get started on your journey with Striim by signing up for free with Striim Developer or Striim Cloud.
Learn more about data streaming using Striim through our other Tutorials and Recipes.
Detect Anomalies and Process Data Streams with Pattern Matching: A Financial Services Example
How you can use rule-based, Complex Event Processing (CEP) to detect real world patterns in data
Benefits
Operational Analytics Use non-intrusive CDC to Kafka to create persistent streams that can be accessed by multiple consumers and automatically reflect upstream schema changes
Empower Your TeamsGive teams across your organization a real-time view of your Oracle database transactions.Get Analytics-Ready DataGet your data ready for analytics before it lands in the cloud. Process and analyze in-flight data with scalable streaming SQL.
On this page
Introduction
Striim is a unified real-time data streaming and integration product that enables continuous replication from various data sources, including databases, data warehouses, object stores, messaging systems, files, and network protocols. The Continuous Query (CQ) component of Striim uses SQL-like operations to query streaming data with almost no latency.
Pattern matching in data pipelines is often used to run transformations on specific parts of a data stream. In particular, this is a common approach in the finance industry to anonymize data in streams (like credit card numbers) or act quickly on it.
Striim works with a financial institution that has a need to correlate authorization transactions and final capture transactions which typically are brought into their databases as events. Their current process is overly complicated where a sequence of hard queries are made on the databases to see if a set of rows are matching a specific pattern by a specific key. The alternative is to have Databases or Data Warehouses like Oracle/Snowflake use MATCH_RECOGNIZE to do this as a single query; however, for a data stream this has to be done for all the events and the queries hit on the database will be even worse and may need to be done in batches.
We can use the MATCH_PATTERN and PARTITION BY statements in Striim’s Continuous Query component to process the data in real-time. Striim’s CQ can also mask the credit card numbers to anonymize personally identifiable information. The entire workflow can be achieved with Striim’s easy-to-understand architecture This tutorial walks through an example we completed with a fictitious financial institution, First Wealth Bank, on using pattern matching and Continuous Query to partition masked credit cards and process them, which is possible only with Striim’s ability to transform, enrich, and join data in realtime.
Use Case
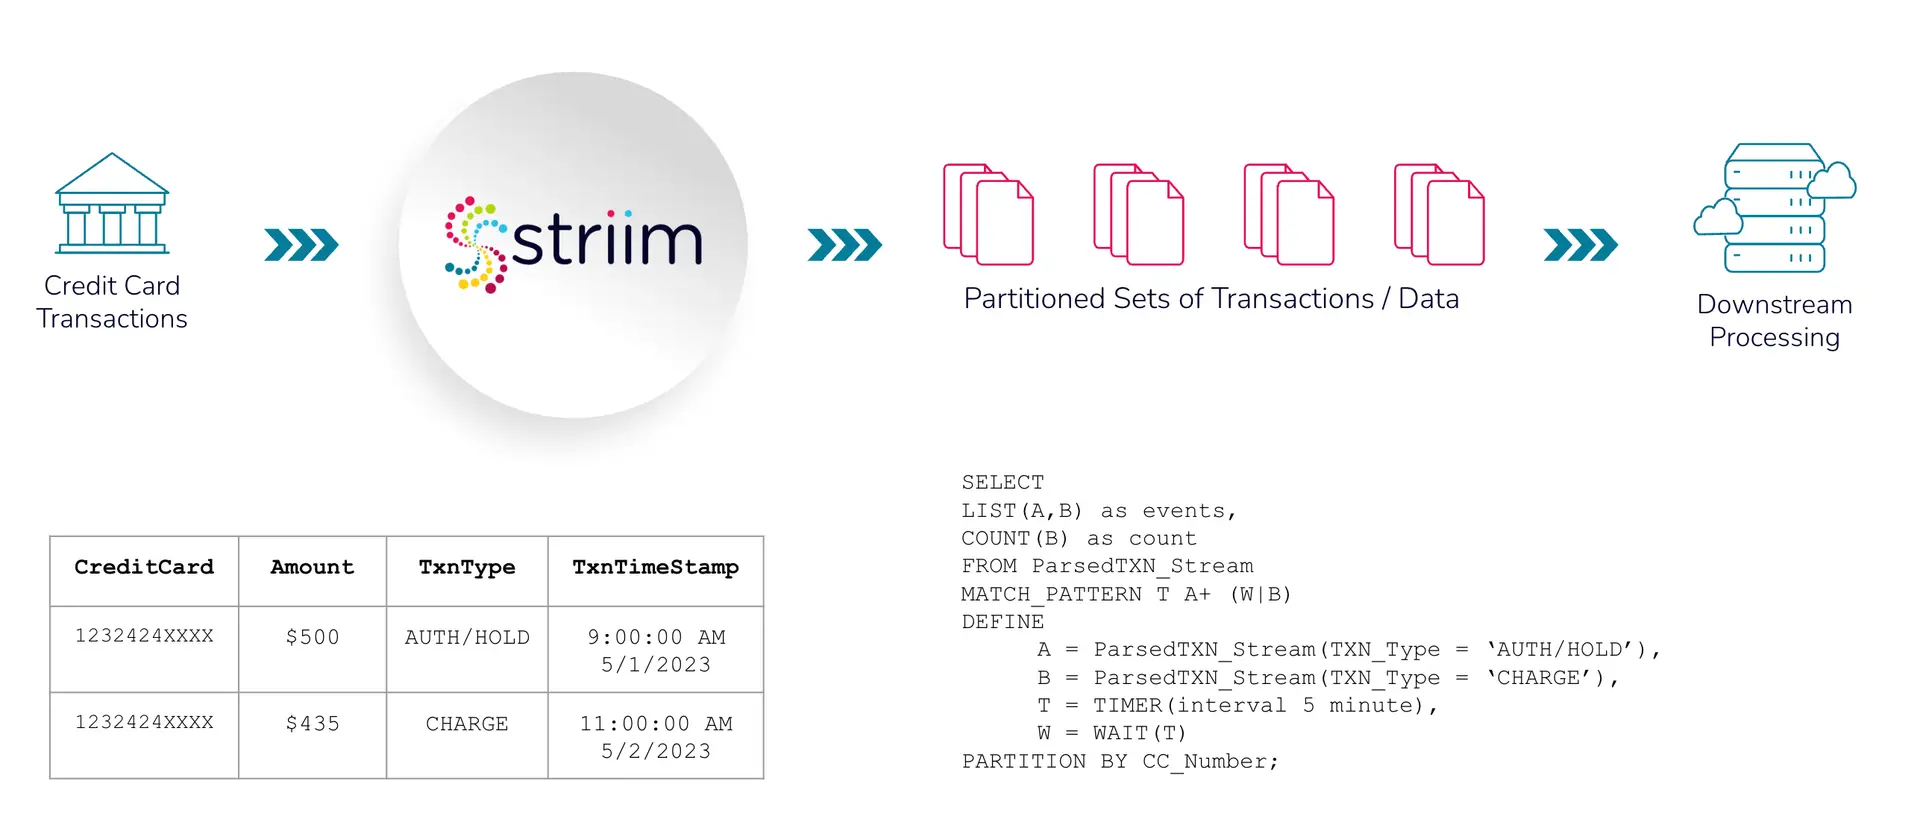
Imagine you are staying at a hotel, “Hotel California”, and from the moment you check-in until you check-out, they charge your credit card with a series of “auth/hold” transactions. At check-out the hotel creates a “Charge” transaction against the prior authorizations for the total bill, which is essentially a total sum of all charges incurred by you during your stay.
Your financial institution, “First Wealth Bank”, has a streaming transaction pattern where one or more Credit Card Authorization Hold (A) events are followed by a Credit Card Charge (B) event or a Timeout (T) event which is intended to process your charges accurately.
With Pattern Matching & Partitioning, Striim can match these sequences of credit card transactions in real-time, and output these transactions partitioned by their identifiers (i.e Credit Card/Account/Session ID numbers) which would ultimately simplify the customer experience.
Data Field (with assumptions)
BusinessID = HotelCalifornia CustomerName = John Doe CC_Number = Credit-Card/Account number used by customer. ChargeSessionID (assumption) = CSNID123 – we are assuming this is an id that First Wealth Bank provides as part of authorization transaction response. This id repeats for all subsequent incremental authorizations. If not, we will have to use CreditCard number. Amount = hold authorization amount in dollars or final payment charge. TXN_Type = AUTH/HOLD or CHARGE TXN_Timestamp = datetime when transaction was entered.
As shown in the above schematic, credit card transactions are recorded in financial institutions (in this case, First Wealth Bank) which is streamed in real-time. Data enrichment and processing takes place using Striim’s Continuous Query. Credit card numbers are masked for anonymization, followed by partitioning based on identifiers (credit card numbers). The partitioned data is then queried to check the pattern in downstream processing, ‘Auth/Hold’ followed by ‘Charge’ or ‘Auth/Hold’ followed by ‘Timeout’ for each credit.
Core Striim Components
MS SQL Reader: Reads from SQL Server and writes to various targets.
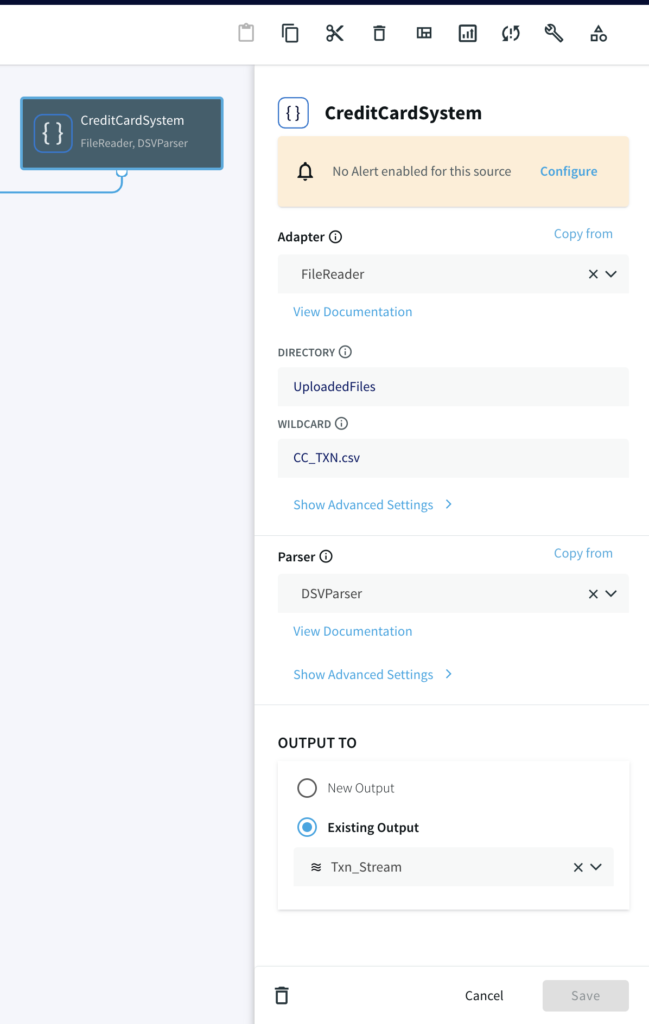
Filereader: Reads files from disk using a compatible parser.
Continuous Query: Striim’s continuous queries are continually running SQL queries that act on real-time data and may be used to filter, aggregate, join, enrich, and transform events.
Window: A window bounds real-time data by time, event count or both. A window is required for an application to aggregate or perform calculations on data, populate the dashboard, or send alerts when conditions deviate from normal parameters.
Stream: A stream passes one component’s output to one or more components. For example, a simple flow that only writes to a file might have this sequence.
FileWriter: Writes to a file in various format (csv, json etc)
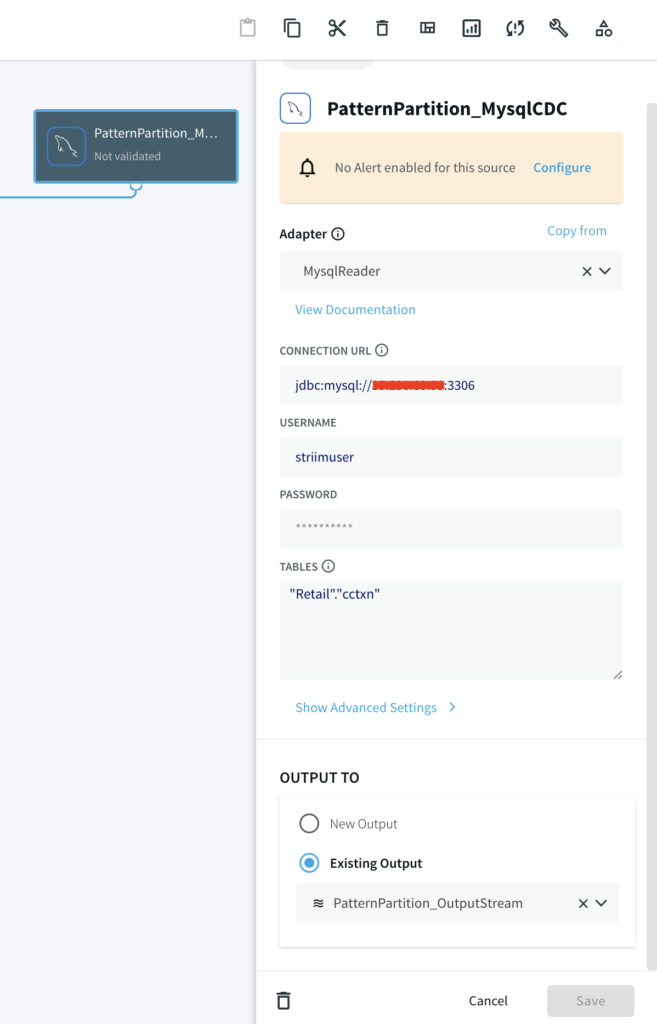
Step 1: Configure your source
For this tutorial, you can either use MySQL CDC to replicate a real-life business scenario or a csv file if you do not have access to MySQL database.
Striim Demo w/ MySQL CDC
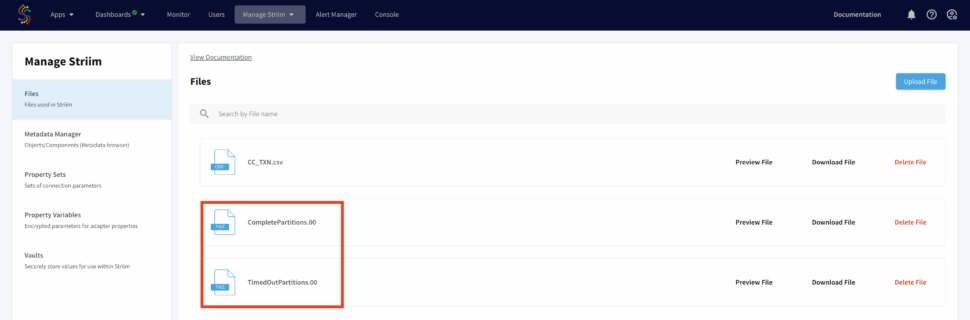
A CDC pipeline that has MySQL/Oracle as source with above data added as sequence of events. The output are two files, CompletePartitions (Pattern Matched) and TimedOutPartitions (Timer ran down with incomplete CHARGE) for each identifier (Credit Card Number/ Session id).
Demo Data Size
1 million events (transactions) over 250,000 partitions
50,000 partitions for success/complete partitions
200,000 partitions for incomplete/timed-out partitions
The Python script that writes data to your SQL database can be found here.
Striim Demo w/ FileReader CDC-like Behavior
A File Reader-Writer pipeline that can be run locally without relying on a external working database. This utilizes a python script to write data into a csv file.
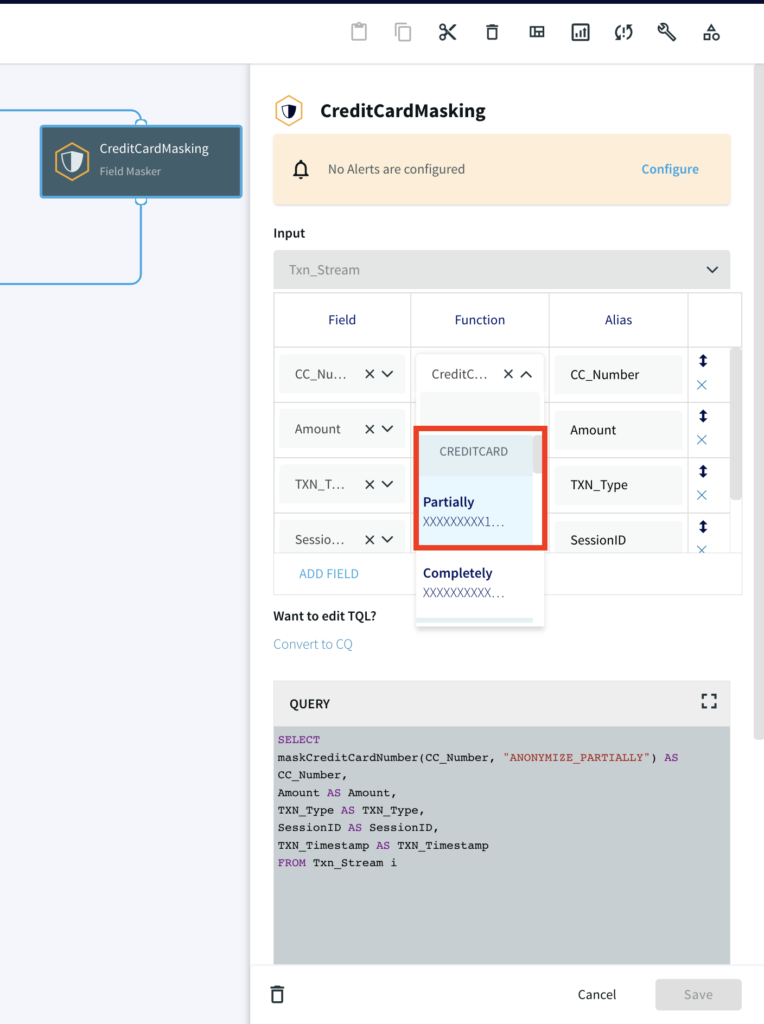
Step 2: Mask the Credit Card Numbers
Striim utilizes inbuilt masking function to anonymize personally identifiable information like credit card numbers. The function maskCreditCardNumber(String value, String functionType) masks the credit card number partially or fully as specified by the user. We use a Continuous Query to read masked data from the source.
					SELECT
maskCreditCardNumber(CC_Number, "ANONYMIZE_PARTIALLY") AS CC_Number,
Amount AS Amount,
TXN_Type AS TXN_Type,
SessionID AS SessionID,
TXN_Timestamp AS TXN_Timestamp
FROM Txn_Stream i;
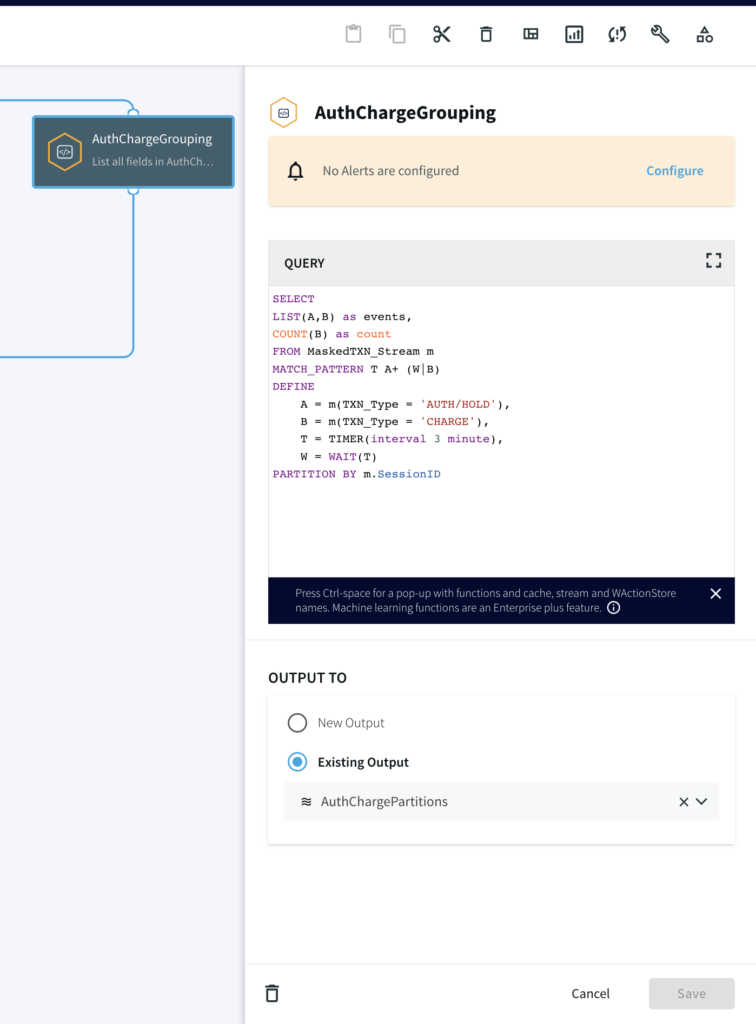
Step 3: Continuous Query (w/ Pattern Match & Partitions)
Next, we write a continuous query on the data with masked credit card numbers to partition the events by their distinct CC_NUMBER. The pattern logic for the CQ is:
Start the pattern on the first event of ‘A’ (an event where the TXN_Type is AUTH/HOLD) for a particular CC_NUMBER
With ‘A’ event to start the pattern, start the timer (mimicking the hold time) for 3 minutes
Accumulate any incoming ‘A’ events until either the following happens:
‘W’ occurs where the Timer runs down OR
event ‘B’ occurs where the TXN_Type is CHARGE
					SELECT
LIST(A,B) as events,
COUNT(B) as count
FROM MaskedTXN_Stream m
MATCH_PATTERN T A+ (W|B)
DEFINE
A = m(TXN_Type = 'AUTH/HOLD'),
B = m(TXN_Type = 'CHARGE'),
T = TIMER(interval 3 minute),
W = WAIT(T)
PARTITION BY m.SessionID
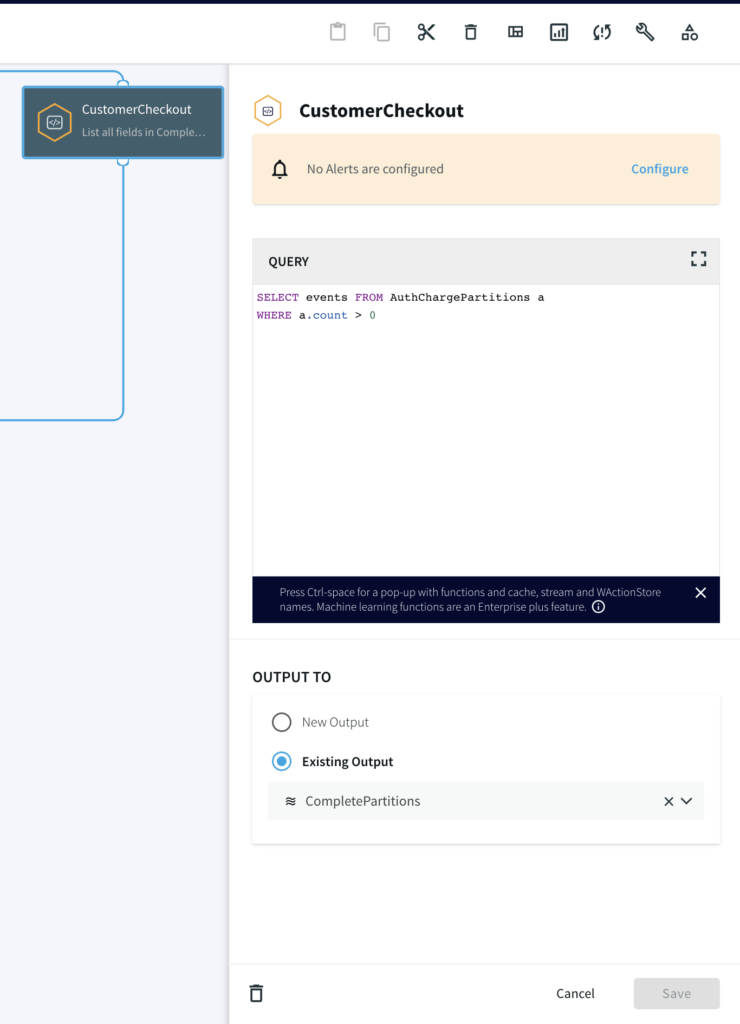
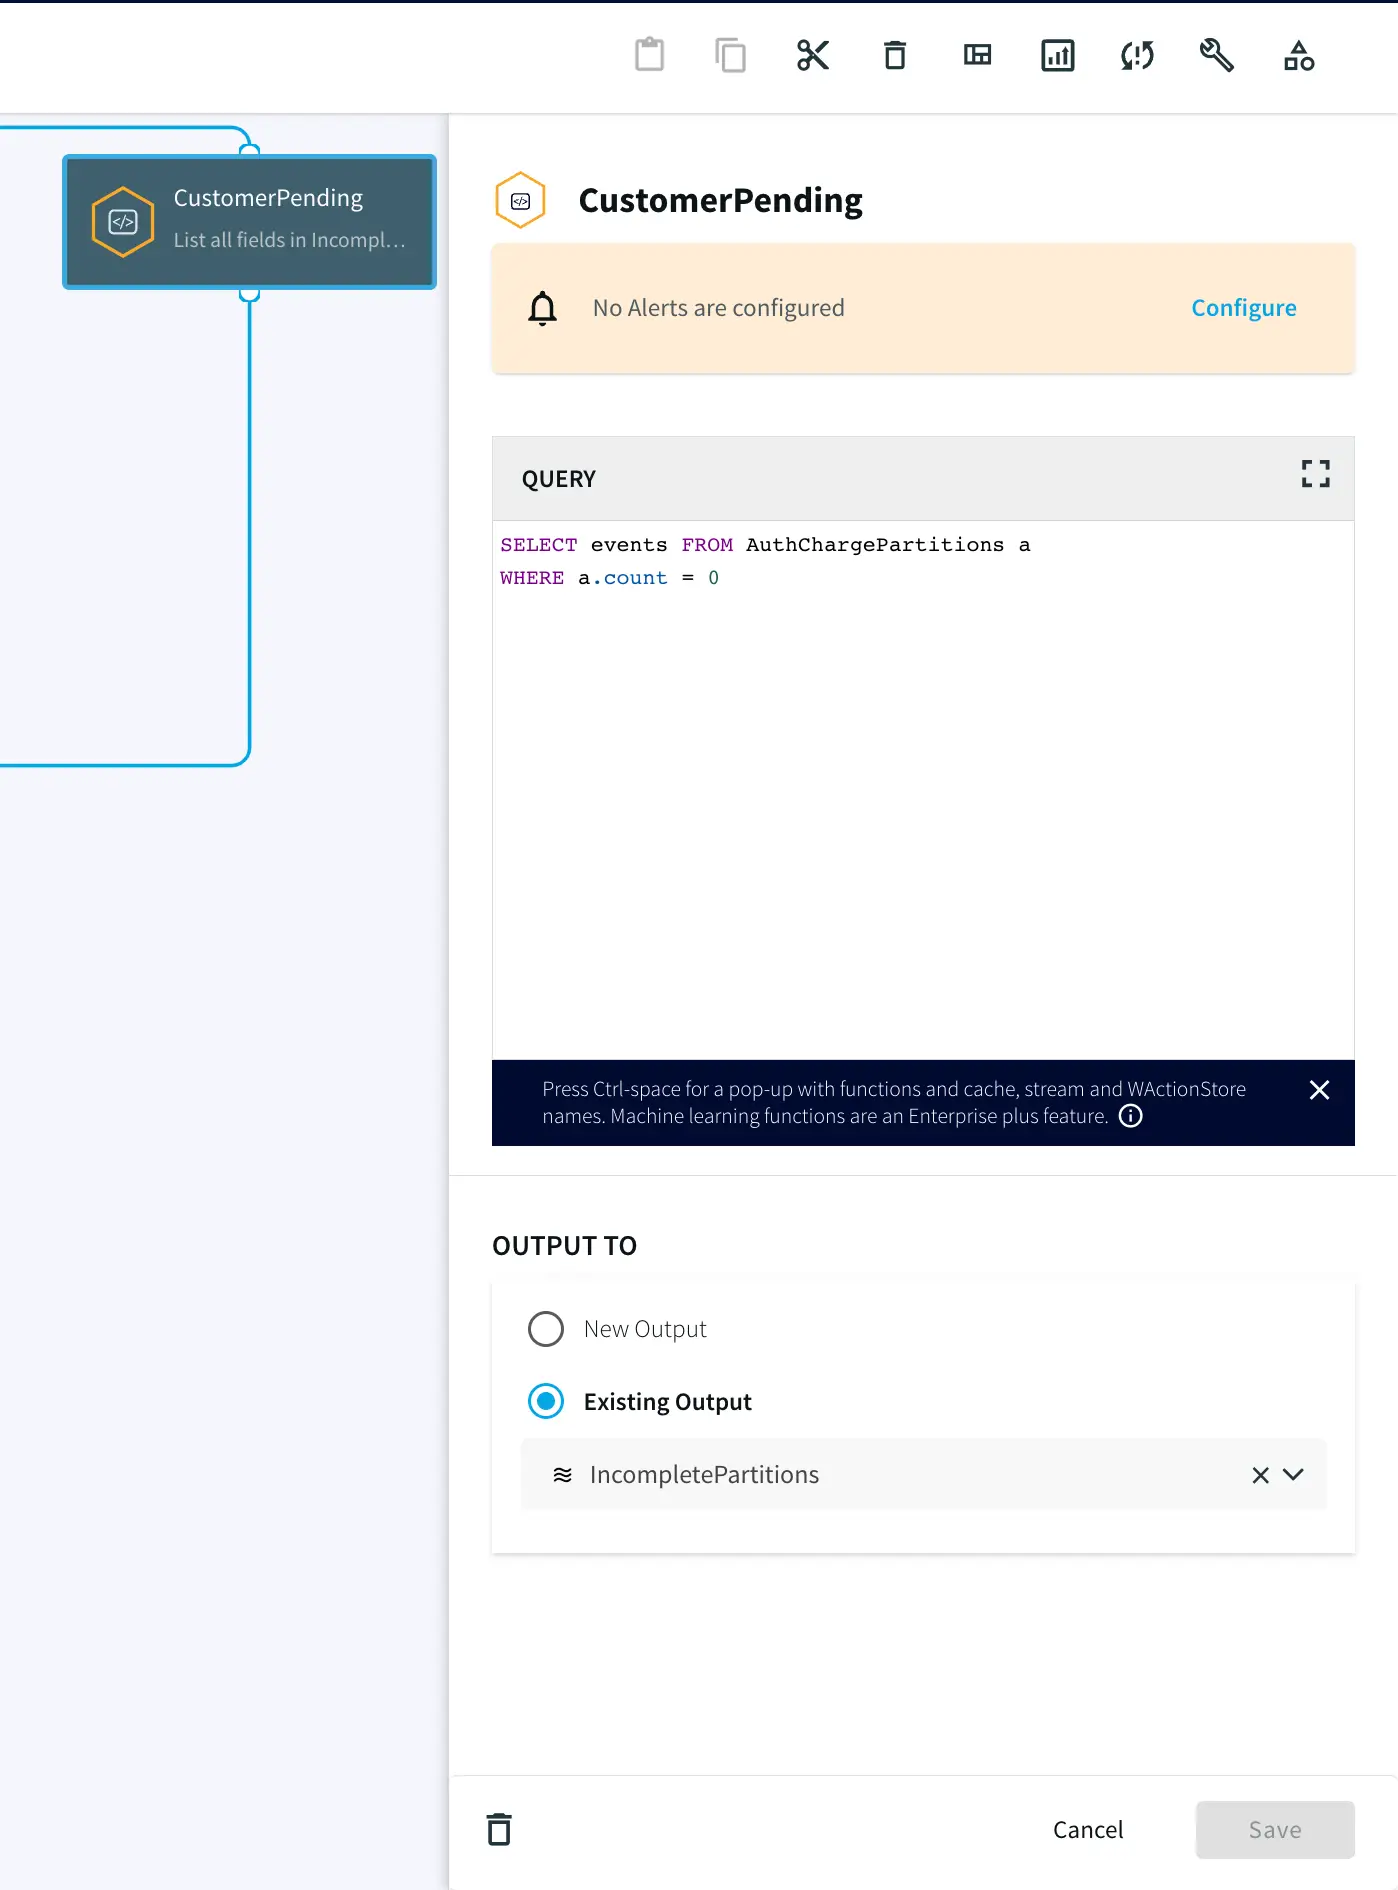
Step 4: Split the data into Complete and TimedOut Criteria
In this step, two Continuous Queries are written to split the data into two categories. One where the credit cards has been Charged and other where there was no charge until timeout.
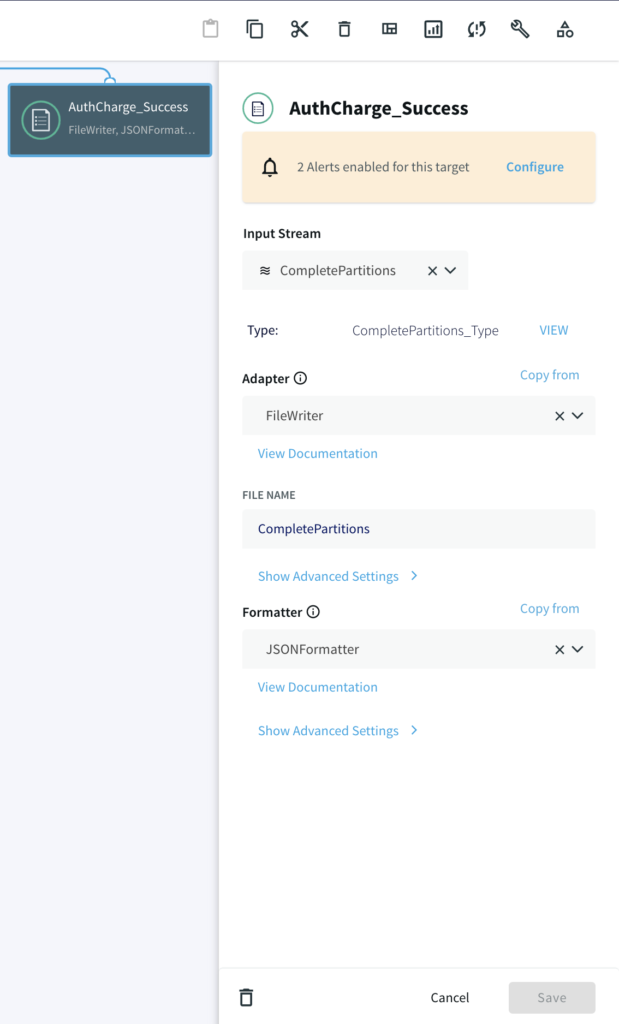
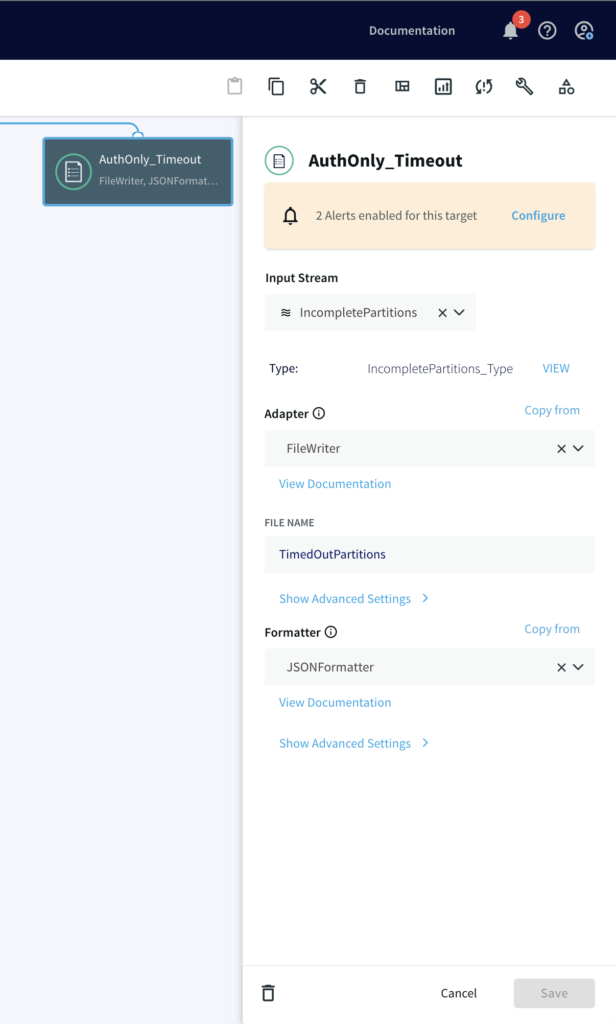
Step 5: Write the Output using FileWriter
Once all events (‘A’ and ‘B’) are accumulated in the partition, two different files are written, one where timers ran down with incomplete charge and other where the credit card was actually charged after auth/hold.
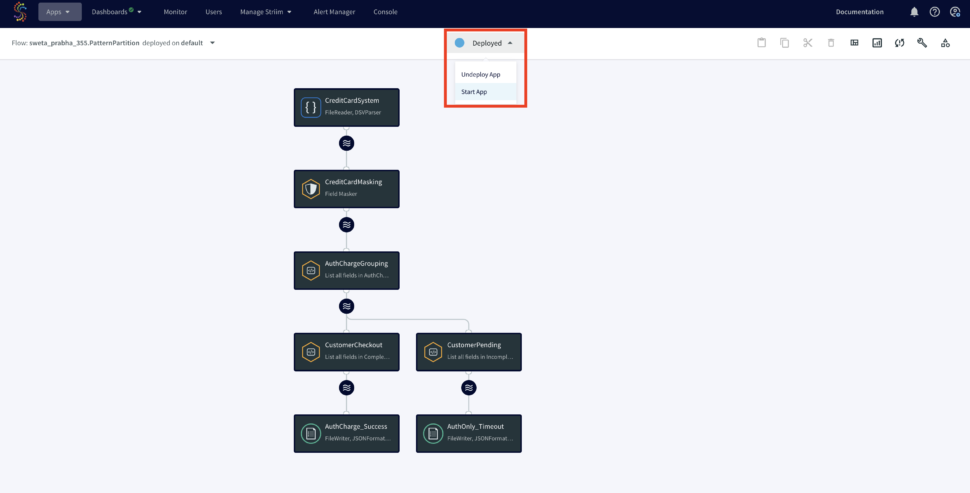
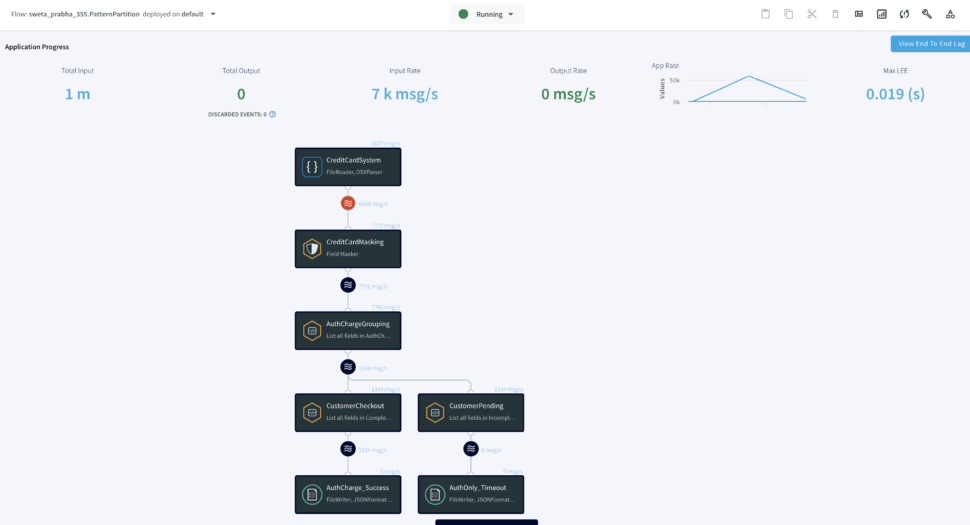
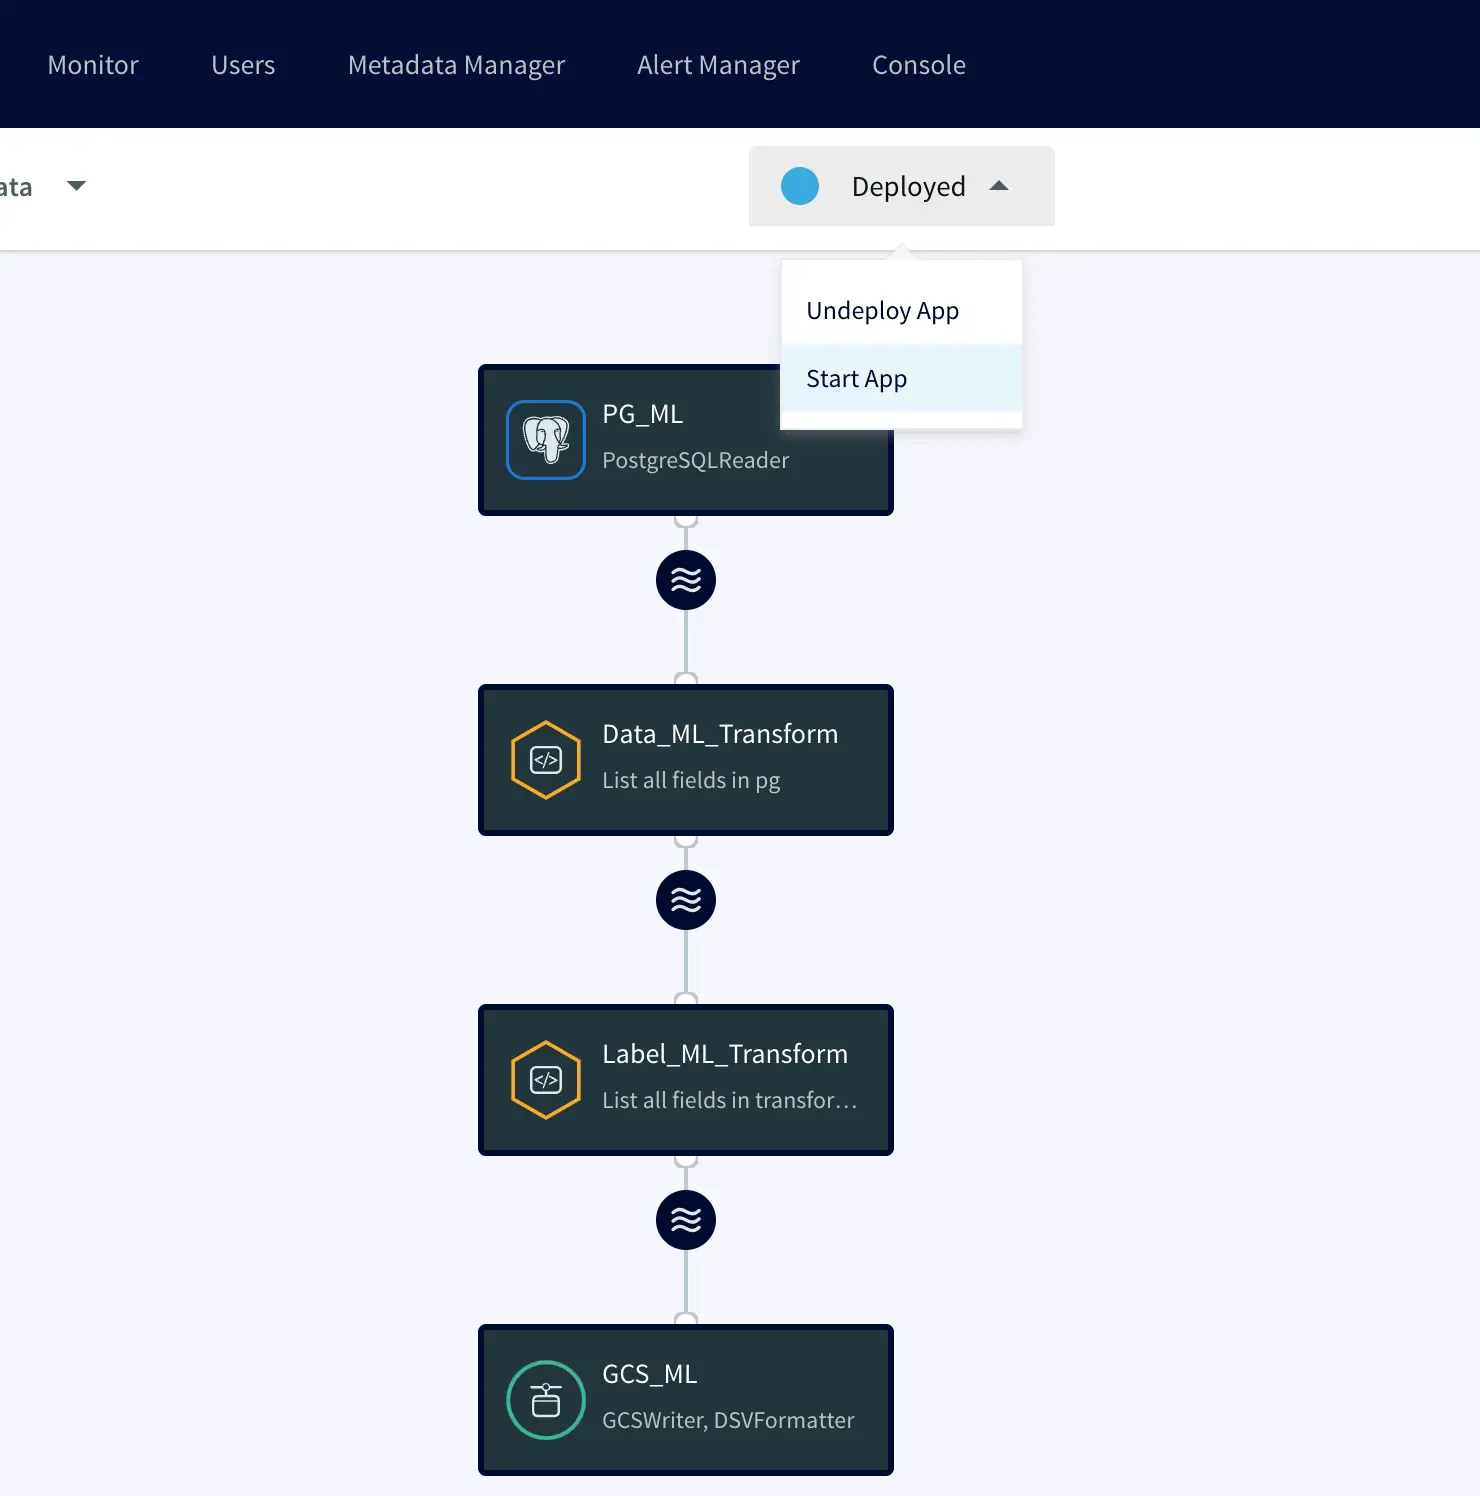
Run the Striim App
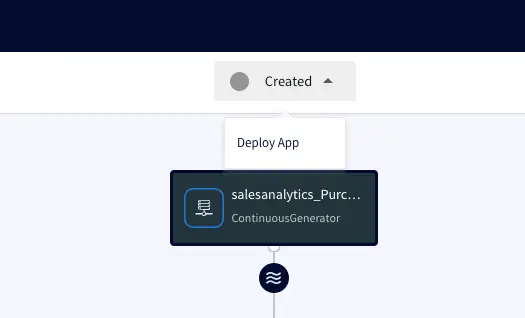
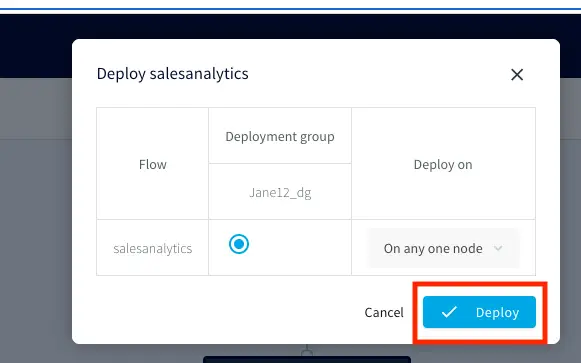
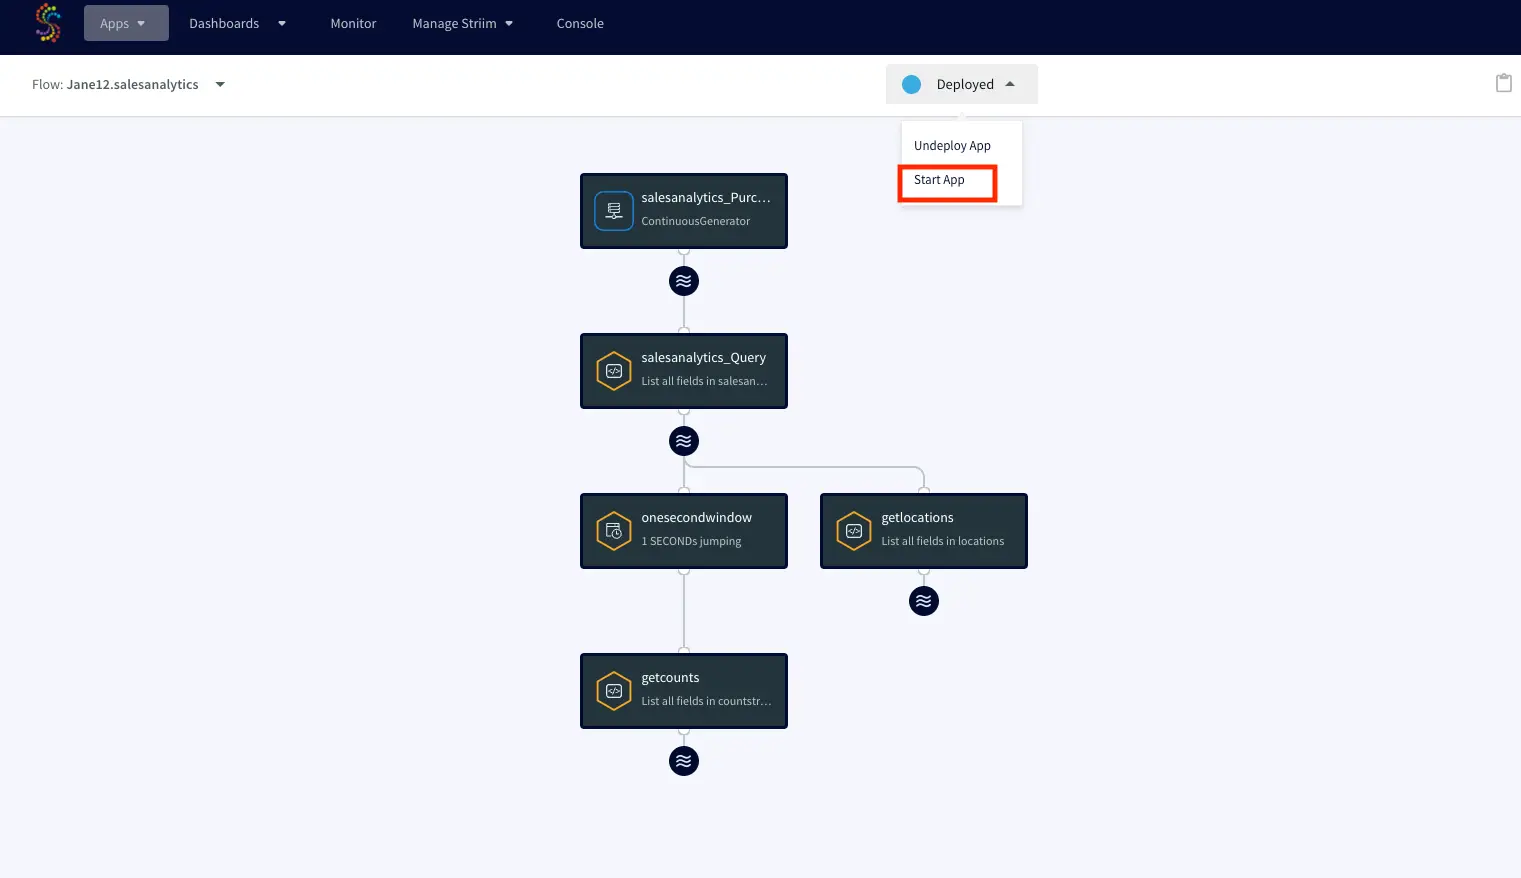
You can import the TQL file from here and run the app by selecting ‘Deploy’ followed by ‘Start App’ from the dropdown as shown below:
Once the Striim app starts running you can monitor the input and output data from the UI. To learn more about app monitoring, please refer to the documentation here.
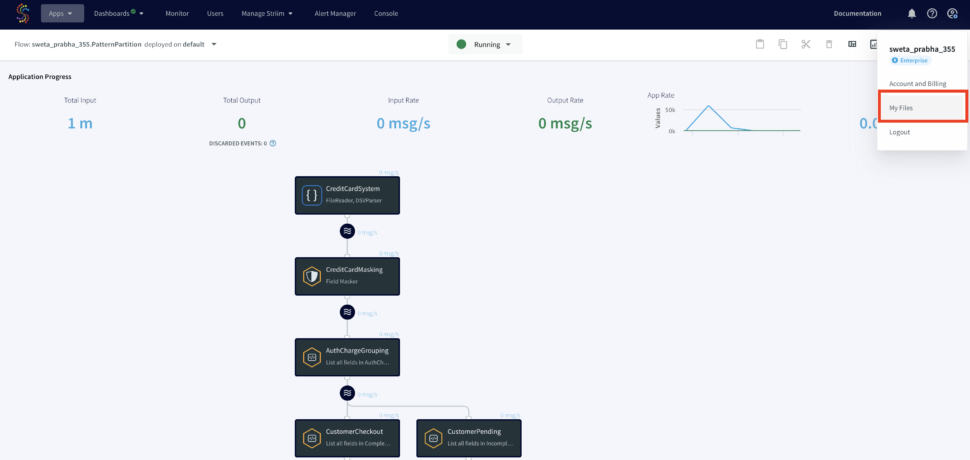
The output files will be stores under ‘My Files’ in the web UI as shown below:
Wrapping Up
As you can see in this use case, Striim can help organizations simplify their real-time workflow by processing and enriching data in real-time using Continuous Query.
This concept can be applicable to many financial use-cases, such as Brokerage Industries where streaming trade order fulfillment patterns are analyzed, for example, a Market Order Submitted (A) event is followed by a Market Order Fulfilled (B) event OR a Canceled (C) event. This has to be done in real-time as stock market brokerage does not have time to wait around for batch processing and has a very high SLA for data.
Unlock the true potential of your data with Striim. Don’t miss out—start your 14-day free trial today and experience the future of data integration firsthand. To give what you saw in this recipe a try, get started on your journey with Striim by signing up for free Striim Developer or Striim Cloud.
Power AI models by capturing, transforming, and delivering real-time data
Benefits
Pave the way for informed decision-making and data-driven insights
Capture, transform, and cleanse data for model ingest
Refine raw ML data and securely store it in Google Cloud Storage (GCS)
On this page
Striim’s unified data streaming platform empowers organizations to infuse real-time data into AI, analytics, customer experiences and operations. In this blog post, we’ll delve into how Striim’s real-time ingestion and transformation capabilities can be leveraged to refine raw ML data and securely store it in Google Cloud Storage (GCS). This guide will walk you through the steps needed to create a data pipeline that refines and enriches data before storing it in GCS for further analysis and training.
Prerequisite: Before we embark on our data transformation journey, ensure you have a running instance of Striim and access to its console.
Step-by-Step Guide: Transforming Raw ML Data with Striim
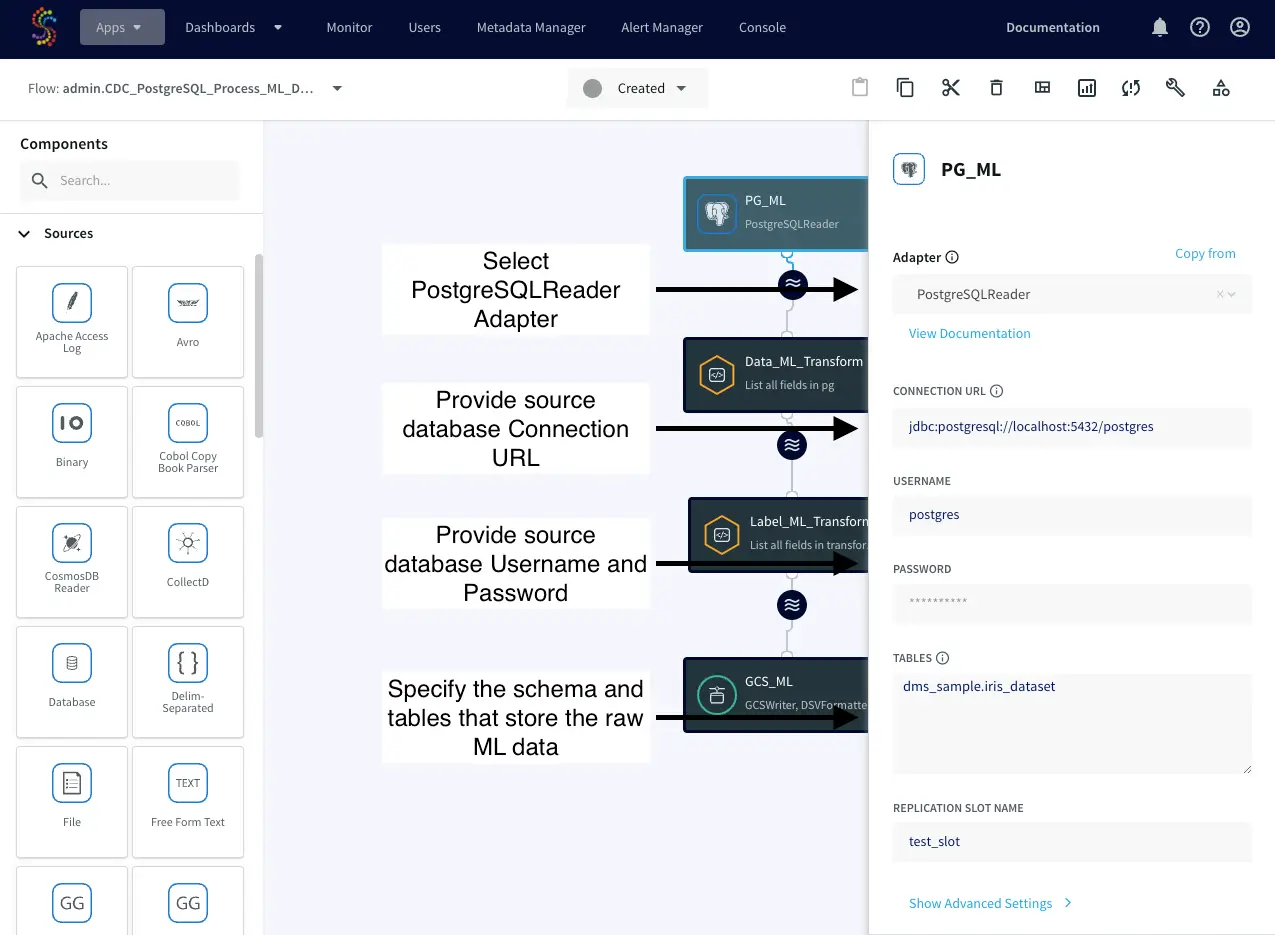
The transformation pipeline consists of four key components, each performing a critical role in reading the incoming data, and enabling the transformation of raw into refined ML data. However, prior to creating the Striim pipeline, we will begin by examining the ML Postgres table that serves as the data repository.
Iris Dataset Table:
Table "dms_sample.iris_dataset"

id            | integer |

sepal_length  | integer |

sepal_width   | integer |

petal_length  | integer |

petal_width   | integer |

species       | text    |
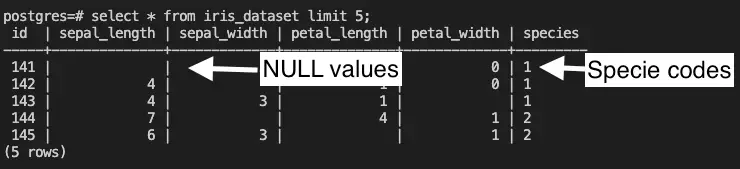
This table is named “iris_dataset”, and it contains information about various characteristics of iris species, like sepal length, sepal width, petal width, and petal length. These are the measurements of the iris plants. The purpose of collecting this information is to use it later to train a classification model and accurately categorize different types of iris species. Unfortunately, the application responsible for ingesting these records into the “iris_dataset” table contains NULL values and provides species codes rather than species names. For example:
In this scenario, Striim is used for real-time data transformation from the ‘iris_dataset’ table. This involves replacing NULL values with 0 and mapping species codes to their respective names. After this cleansing process, the data is formatted into Delimited Separated Values (DSV), securely stored in GCS, and used to train a classification model, such as a Random Forest Classification Model. This model’s main goal is to predict iris species based on the provided characteristics.
Now that we have a clear understanding of the overall use case, we can proceed to creating our data pipeline within Striim.
Component 1: PostgreSQL Reader
Start by creating a PostgreSQL Reader in Striim. This component establishes a connection to the source PostgreSQL database, capturing real-time data as it’s generated using Striim’s log-based Change Data Capture (CDC) technology.
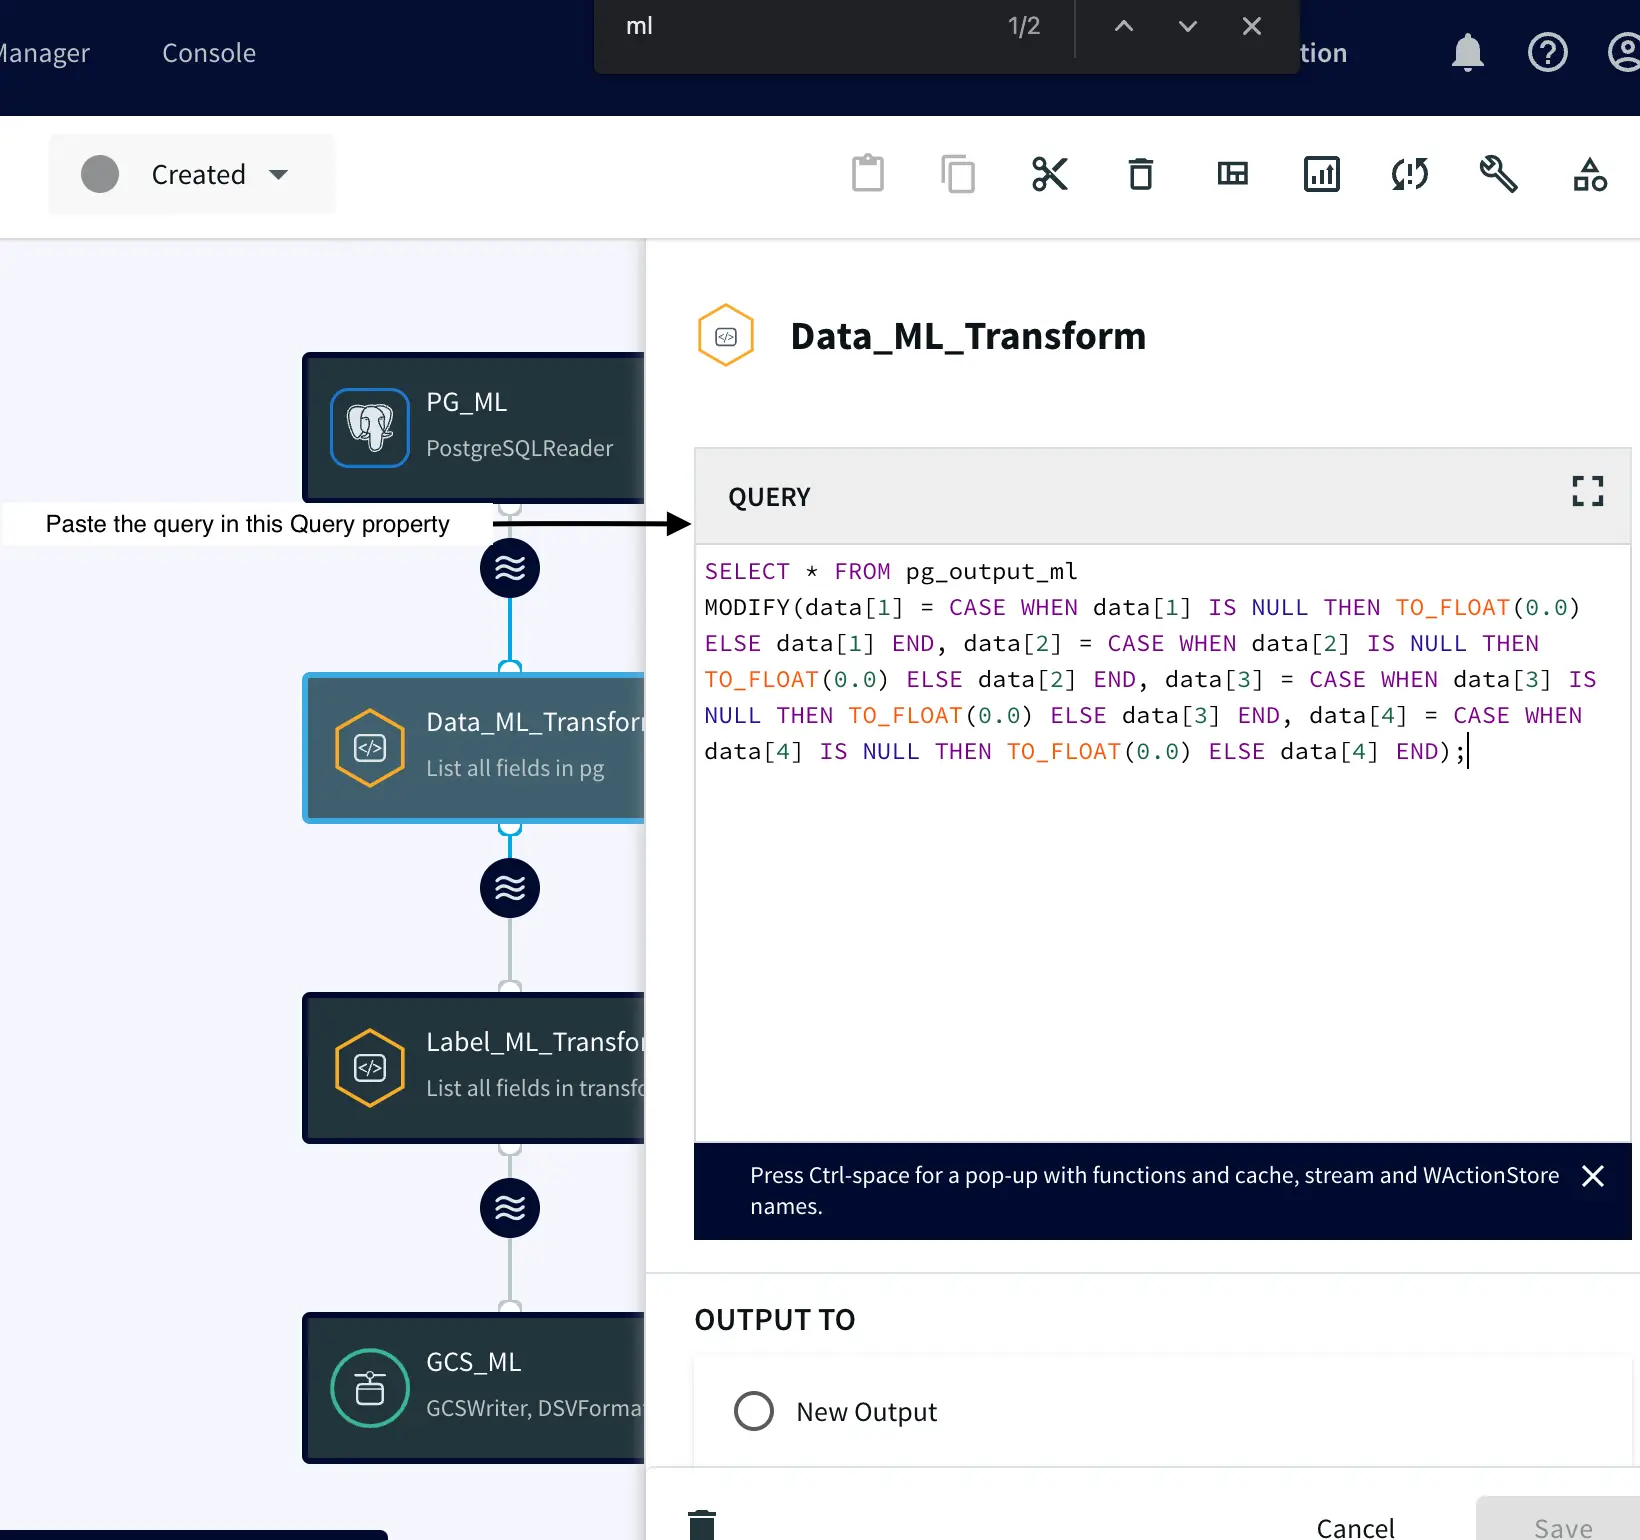
Attach a Continuous Query to the PostgreSQL Reader. This step involves writing a query that replaces any NULL values in the data with ‘0’.
SELECT * FROM pg_output_ml
MODIFY(
   data[1] = CASE WHEN data[1] IS NULL THEN TO_FLOAT(0.0) ELSE data[1] END,
   data[2] = CASE WHEN data[2] IS NULL THEN TO_FLOAT(0.0) ELSE data[2] END,
   data[3] = CASE WHEN data[3] IS NULL THEN TO_FLOAT(0.0) ELSE data[3] END,
   data[4] = CASE WHEN data[4] IS NULL THEN TO_FLOAT(0.0) ELSE data[4] END);
This code retrieves raw data from the “pg_output_ml” output/stream and replaces any NULL values in the specified columns (sepal_length, sepal_width, petal_length, petal_width) with 0, while retaining the original values for non-NULL entries using the MODIFY Striim function. More information: Click Here
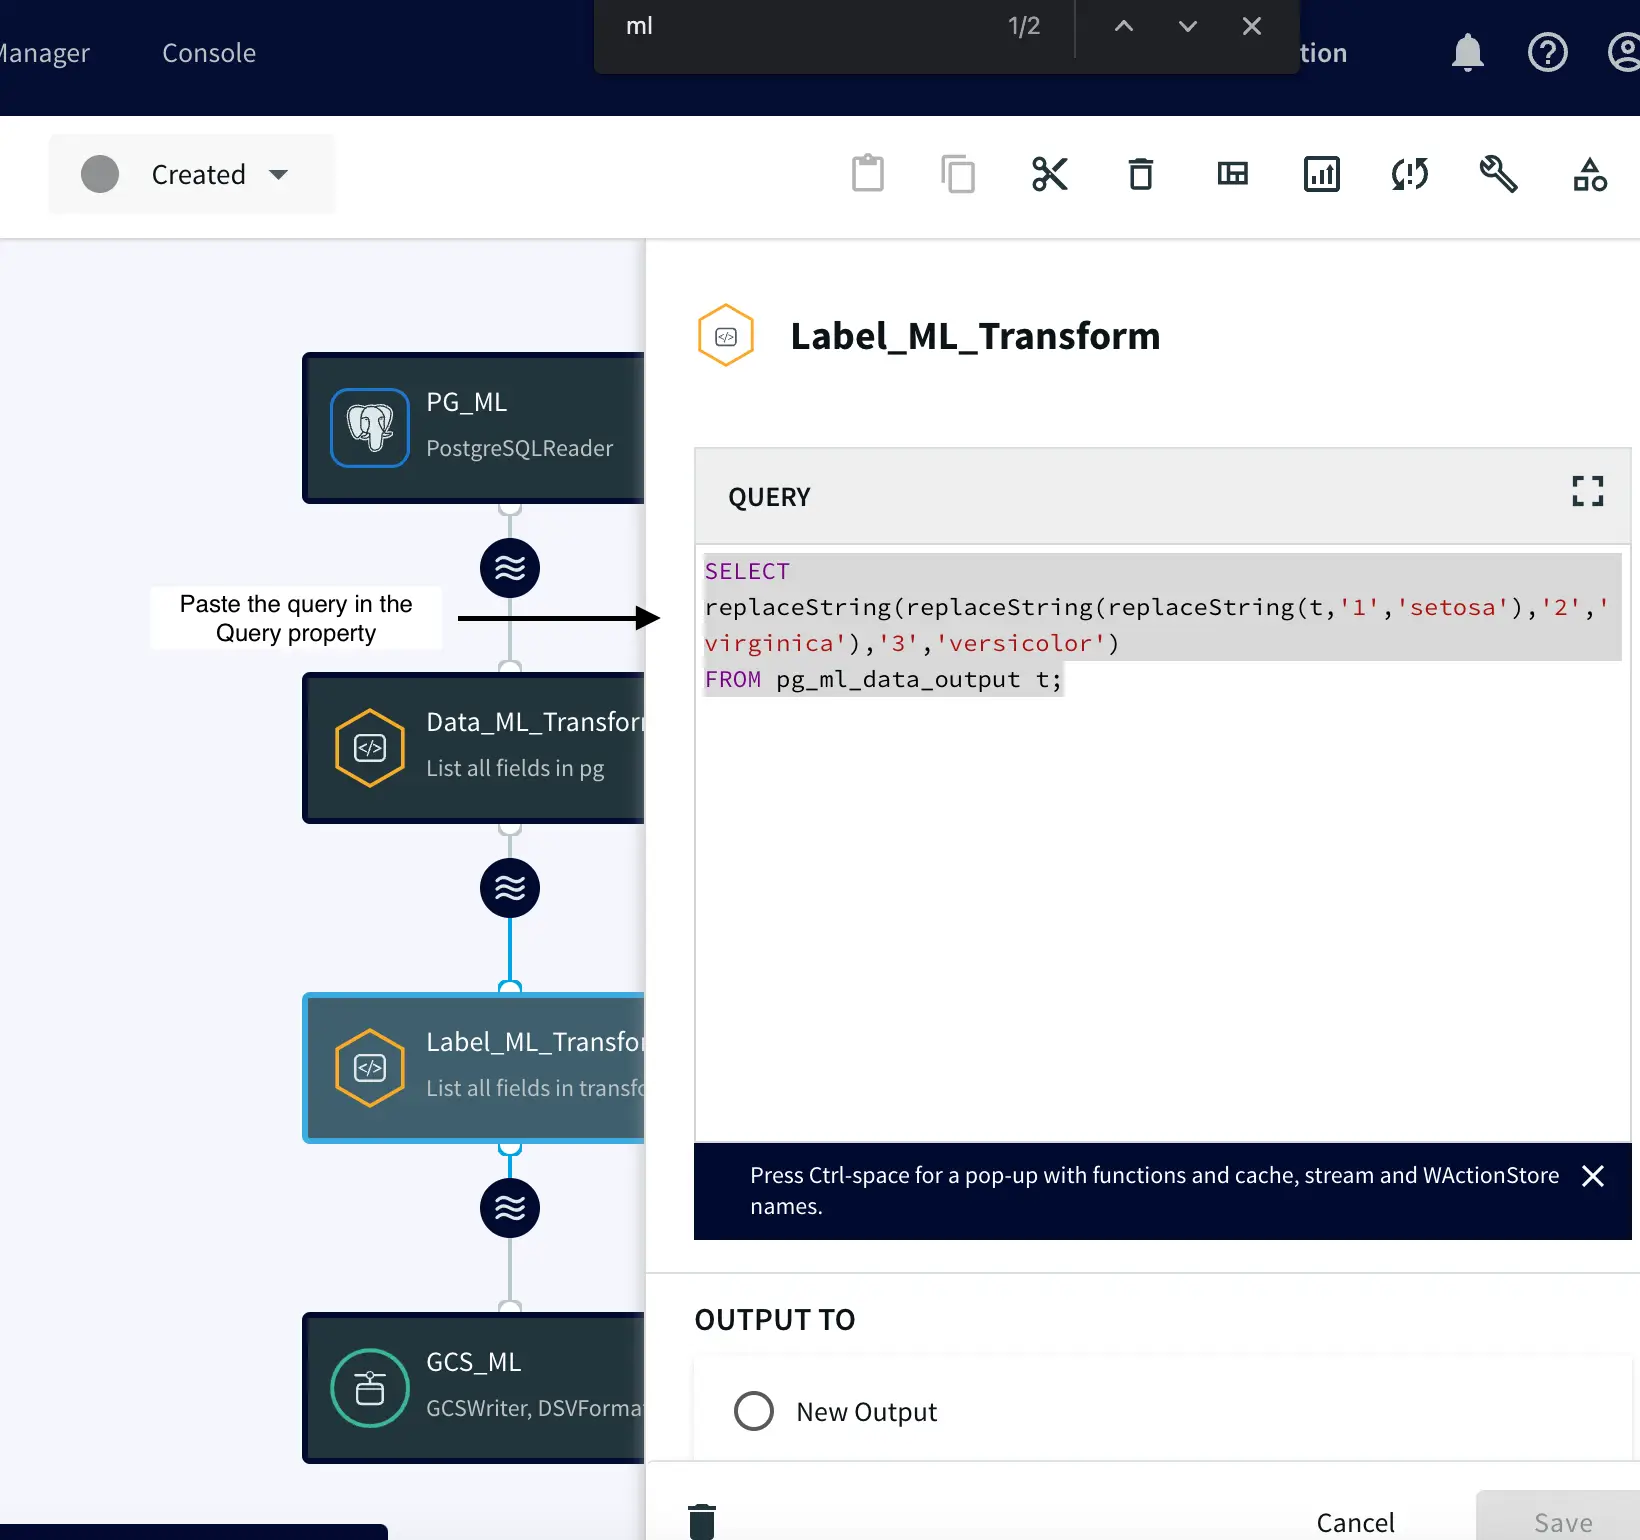
Component 3: Label Transformation
After transforming our data as explained earlier, we proceed to create an additional Continuous Query. This query is pivotal—it replaces numeric labels (1, 2, 3) in the dataset with their corresponding iris species names: setosa, versicolor, and virginica. The labels “setosa,” “versicolor,” and “virginica” are used to denote different iris flower types. This change serves two essential purposes. Firstly, it makes the dataset easier to understand, helping users and stakeholders in intuitively comprehending the data and engaging with model outputs. Secondly, this transformation significantly enhances machine learning model training. By using familiar iris species names instead of numeric codes, models can adeptly capture species distinctions, leading to improved pattern recognition and generalization.
SELECT replaceString(replaceString(
replaceString(t,'1','setosa'),'2','virginica'),'3','versicolor')
FROM pg_ml_data_output t;
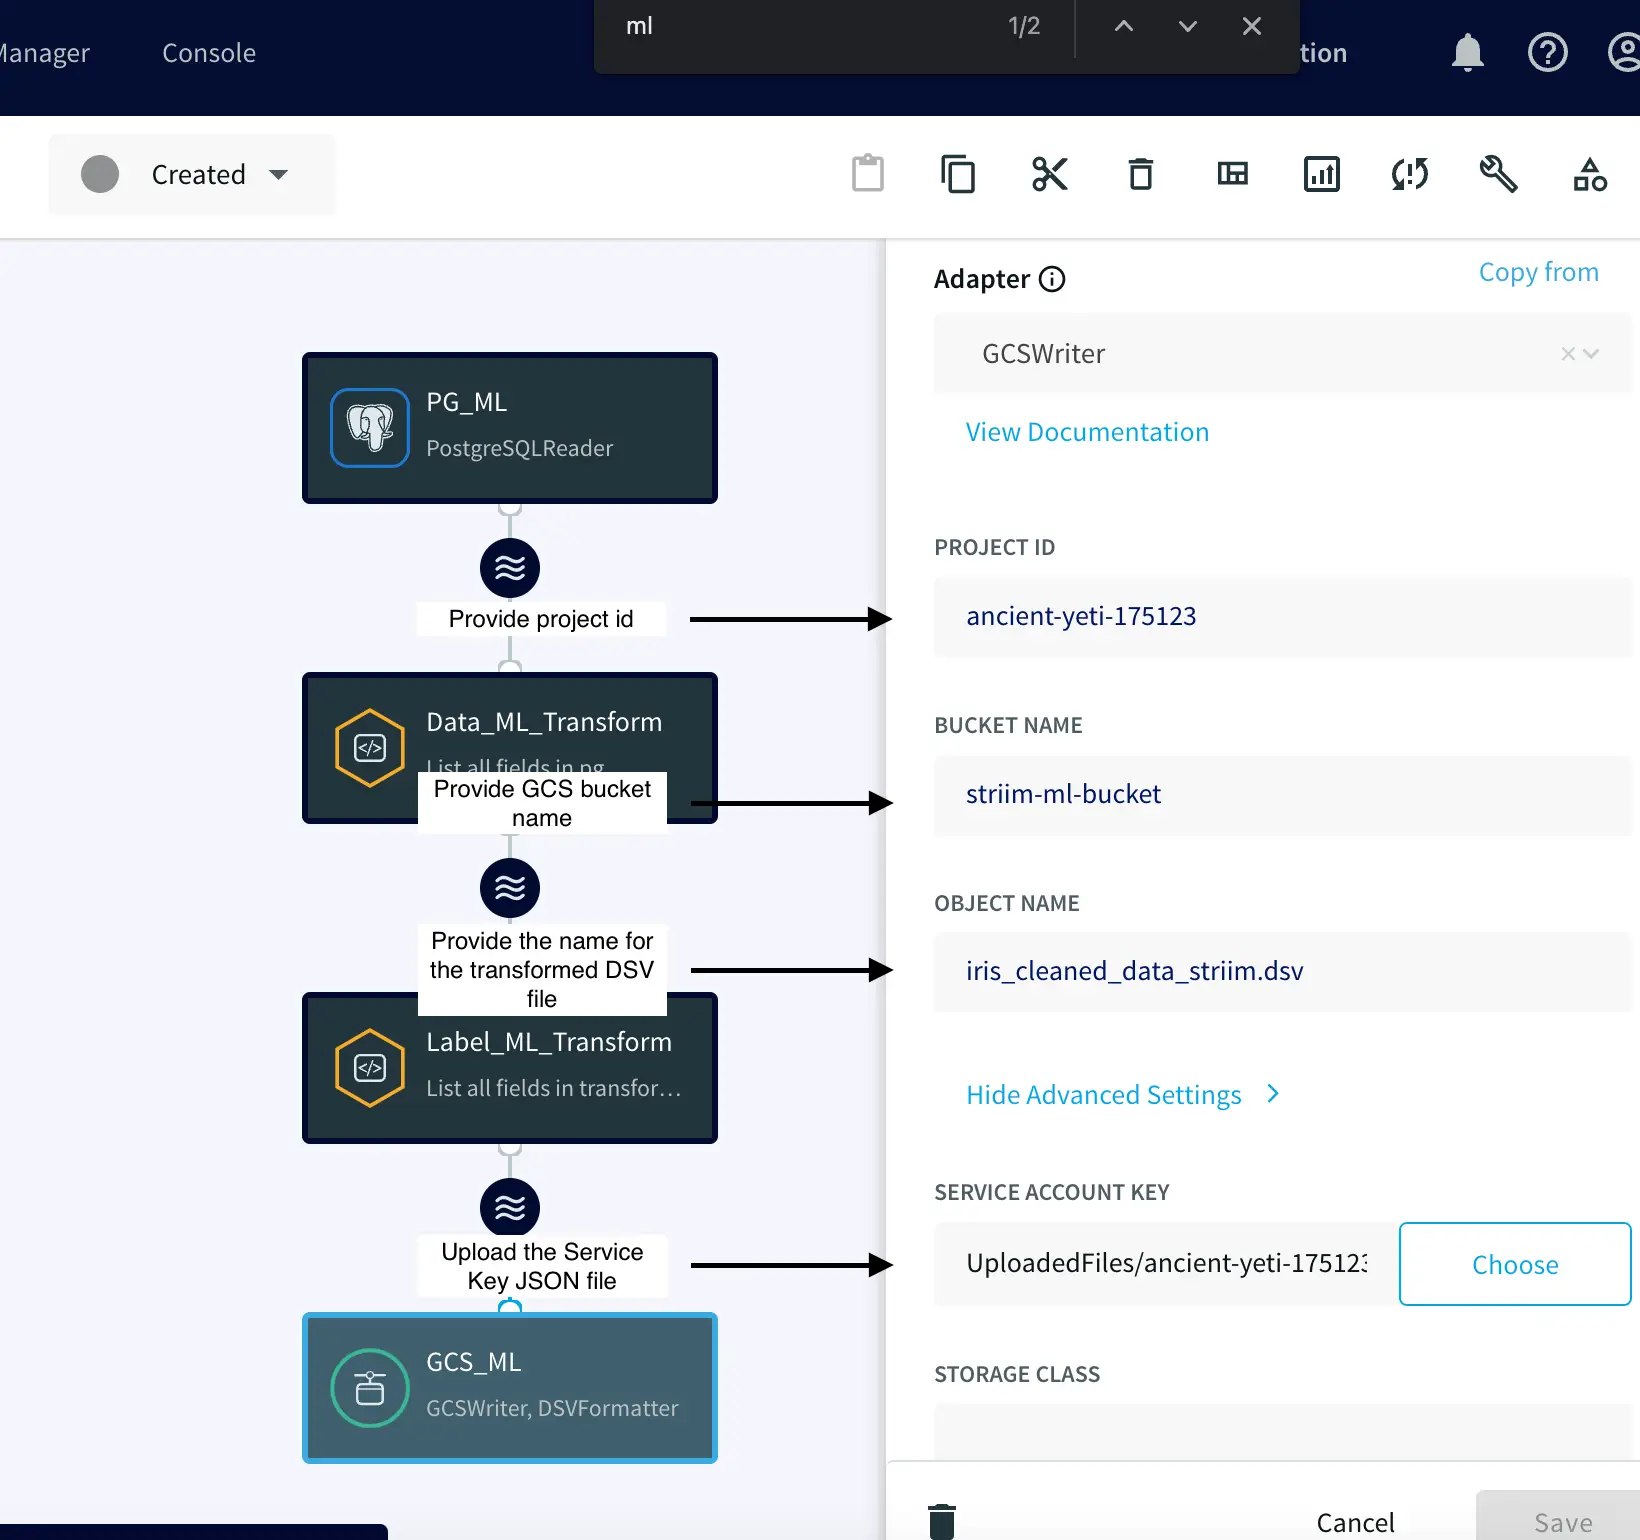
Lastly, attach a GCS Writer to the previous step’s output/stream. Configure this component to store the transformed data as a DSV file in your designated GCS bucket. What’s more, the UPLOAD POLICY ensures that a new DSV file is generated either after capturing 10,000 events or every five seconds.
After creating the pipeline, we can proceed to deploy and start it.
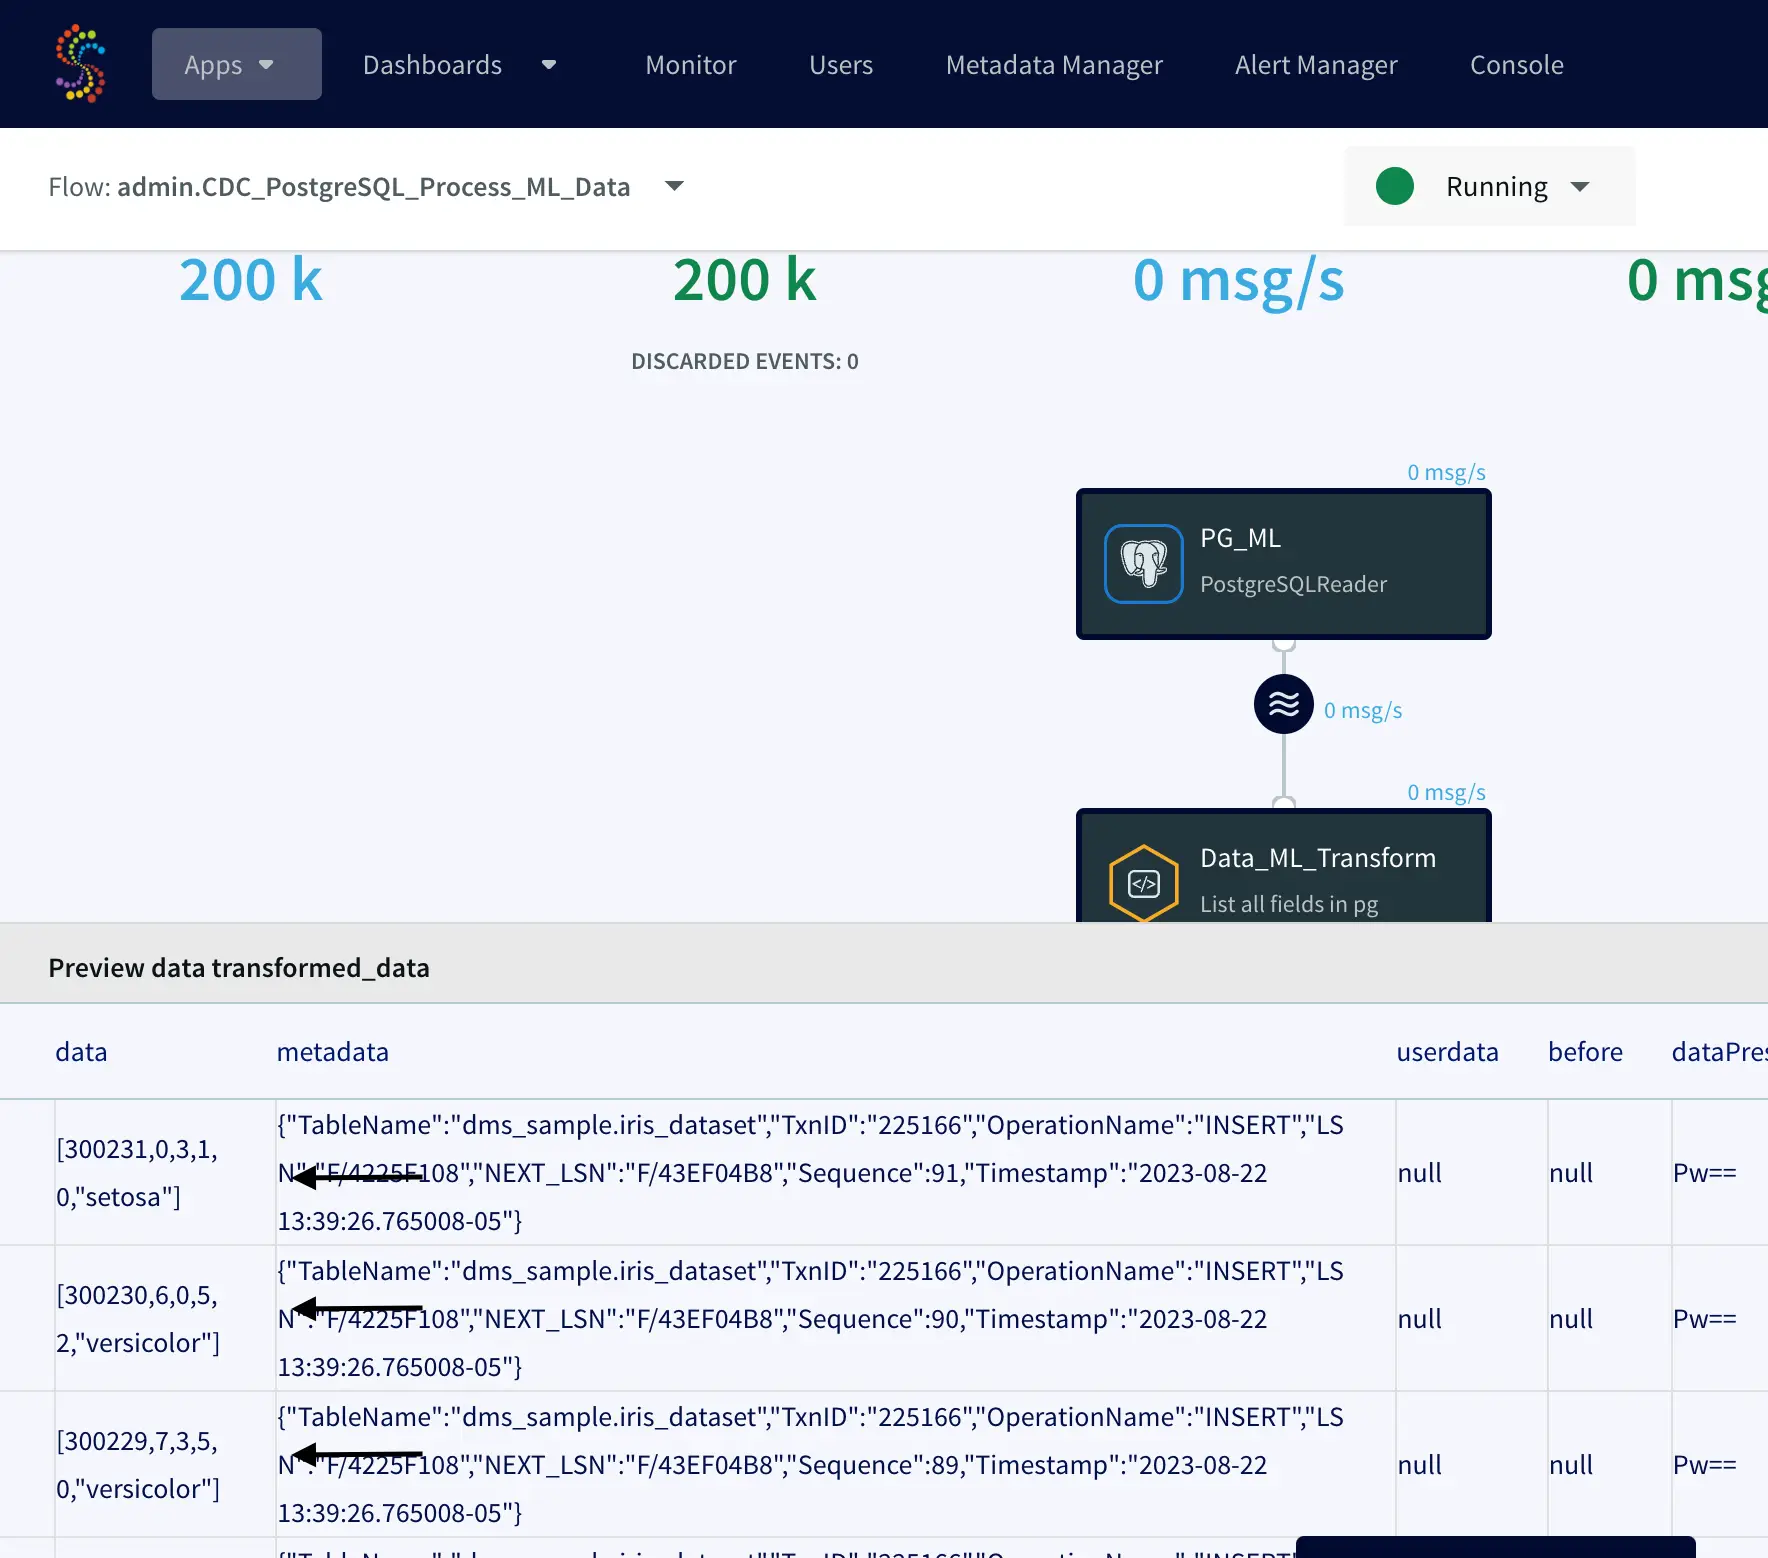
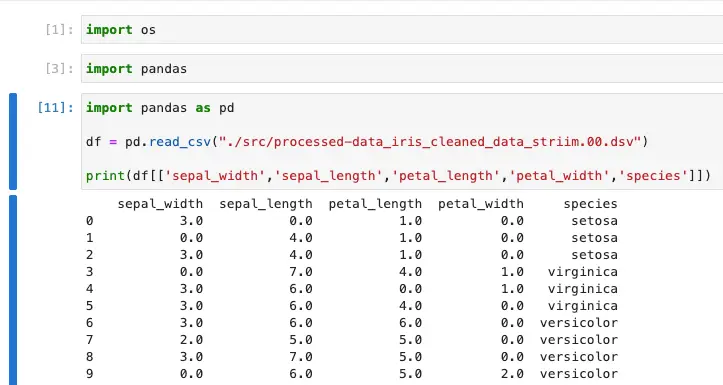
Right after that, Striim began capturing new data in real-time and transforming it on-the-fly:
In the screenshot above, we’re previewing the cleaned data and observing how Striim is transforming NULL values to ‘0’ and converting all the iris species codes to their respective names.
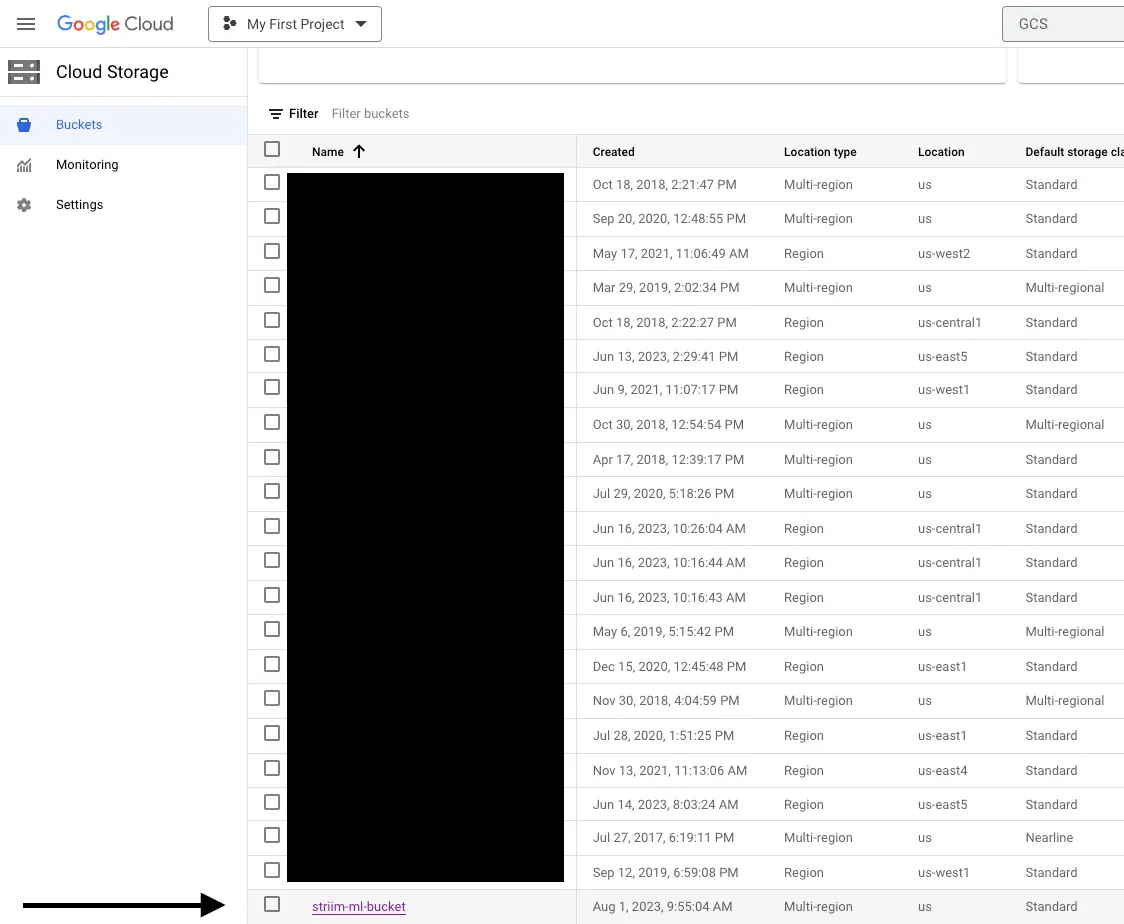
Since the Total Input and Total Output values match, it indicates that Striim has successfully generated files in our GCS bucket (striim-ml-bucket). Now, let’s proceed to your Google Cloud Storage account and locate the bucket.
Step 4: Verification and Visualization
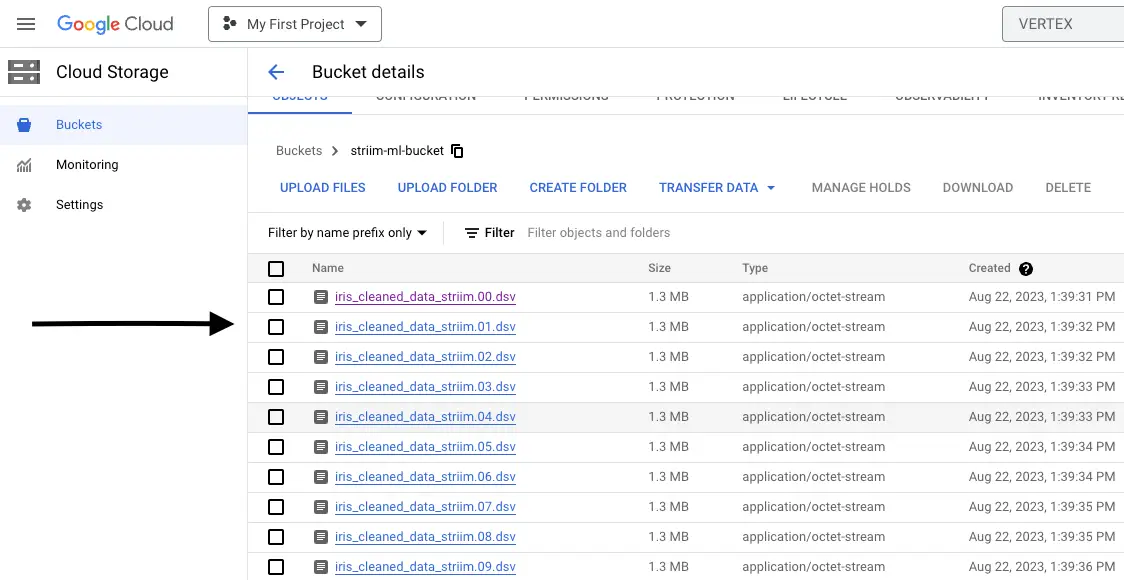
Within the bucket, you’ll find the DSV files created by the GCS Writer.
To verify the contents, we’ll leverage the power of Vertex AI and the Pandas Python library. Upload the DSV file to the JupyterLab instance, load the DSV file using Pandas, and explore its contents. This verification step ensures that the transformations have been successfully carried out, paving the way for subsequent machine learning training and analyses.
Conclusion: Transforming Possibilities with Striim and GCS
Striim’s real-time capabilities open doors to limitless possibilities in data transformation. Constructing a streamlined pipeline that captures, cleanses, and enriches data paves the way for Generative AI and machine learning. For additional details regarding Striim and its data processing capabilities, please refer to:
A Comprehensive Guide to Migrating On-Premise Oracle Data to Databricks Unity Catalog with Python and Databricks Notebook
Seamlessly establish connectivity between the Oracle database and Databricks
Benefits
Migrate your database data and schemas to Databricks in minutes.
Stream operational data from Oracle to your data lake in real-time
Automatically keep schemas and models in sync with your operational database.
On this page
In today’s data-driven world, businesses are constantly seeking ways to enhance data accessibility and accelerate analytics workflows. In this comprehensive guide, we will explore how to seamlessly bring data from an on-premise Oracle database to Databricks Unity Catalog using the powerful combination of Databricks Notebook and Python. Databricks Unity Catalog serves as an enterprise data catalog and collaborative platform for data discovery and management, enabling organizations to centralize and leverage their data assets effectively. Additionally, Striim is a robust real-time data integration platform, which complements Databricks Unity Catalog by facilitating continuous data ingestion and synchronization. By following these step-by-step instructions, you’ll be able to harness the benefits of cloud computing, streamline data integration, and enable data agility for your organization with the integration of Databricks Unity Catalog and Striim.
Before diving into the migration process, ensure you have the following prerequisites in place:
Access to a Striim instance: You will need a functional Striim instance configured to communicate with the source Oracle database and the Databricks environment. If you don’t have a Striim instance set up, refer to the Striim Cloud documentation for deployment and configuration instructions.
Access to a Databricks instance with Unity Catalog enabled: To migrate data from the on-premise Oracle database to Databricks Unity Catalog, you’ll need access to a Databricks instance where Unity Catalog is enabled. If you are unsure how to enable Unity Catalog in your Databricks instance, you can follow the instructions provided in the Databricks documentation: Enabling Unity Catalog.
Ensure that you have created the necessary target schema and tables within the Databricks database prior to proceeding.
Once you have ensured that you meet the prerequisites, follow the steps below to setup your Databricks environment:
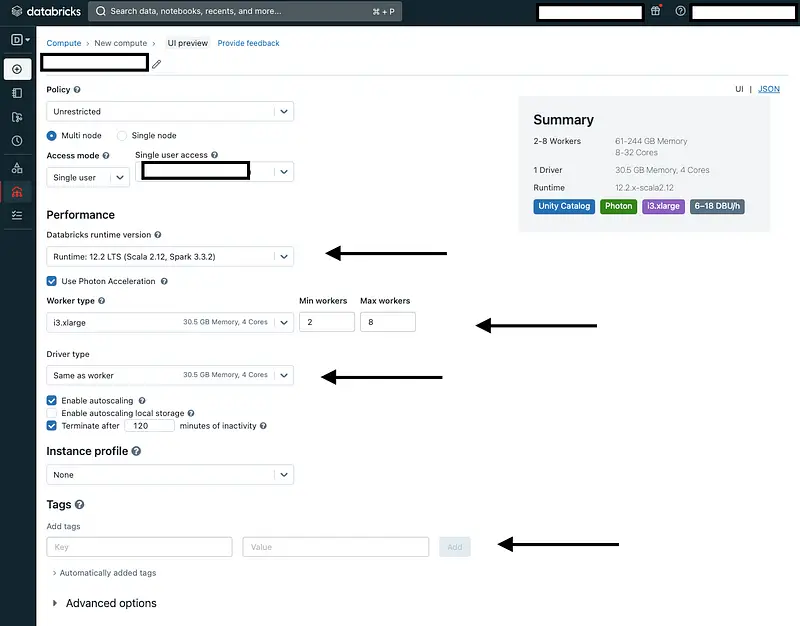
Step 1: Create a Databricks Cluster
In your Databricks instance, navigate to the cluster creation interface. Configure the cluster settings according to your requirements, such as the cluster type, size, and necessary libraries.
Additionally, make sure to set the following environment variables by clicking on “Advanced Options” and selecting “Spark”:
DATABRICKS_ACCESS_TOKEN=<access_token>
PYSPARK_PYTHON=/databricks/python3/bin/python3
ORACLE_JDBC_URL=<jdbc_oracle_conn_url>
DATABRICKS_JDBC_URL=<jdbc_databricks_conn_url>
DATABRICKS_HOSTNAME=<databricks_host>
ORACLE_USERNAME=<oracle_username>
STRIIM_USERNAME=<striim_username> # We will be using the ‘admin’ user
Later in our Databricks notebook, we will extract the values of these environment variables to obtain a Striim authentication token and create our first data pipeline.
Note: To adhere to best practices, it is recommended to use Databricks Secrets Management for storing these credentials securely. By leveraging Databricks Secrets Management, you can ensure that sensitive information, such as database credentials, is securely stored and accessed within your Databricks environment. This approach helps enhance security, compliance, and ease of management.
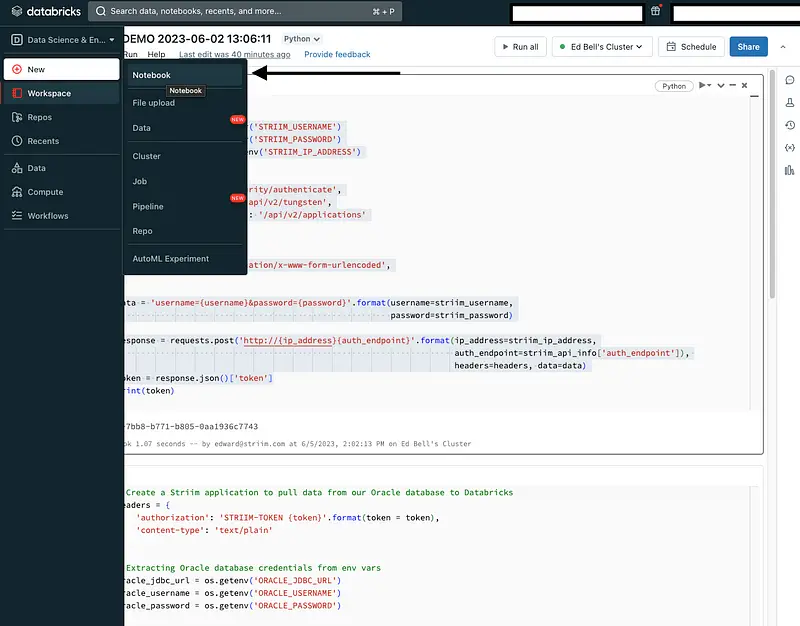
Create a Databricks Notebook: With the cluster up and running, you are ready to create a notebook. To do this, click on “New” in the Databricks workspace interface and select “Notebook.” Provide a name for your notebook and choose the desired programming language (Python) for your notebook.
By creating a notebook, you establish an environment where you can write and execute Python code to perform the necessary data extraction, and loading tasks using Striim.
Once you have created your Databricks Python Notebook, follow the steps below to begin bringing data from an on-prem Oracle database to Databricks Unity Catalog:
Generate an Authentication Token: To interact with the Striim instance programmatically, we will use the Striim REST API. The first step is to generate an authentication token that will allow your Python code to authenticate with the Striim instance:
The code snippet generates an authentication token by making an HTTP POST request to the Striim REST API. It retrieves the Striim username, password, and IP address from environment variables, sets the necessary headers, and sends the request to the authentication endpoint. The authentication token is then extracted from the response for further API interactions.
Step 2: Create a Striim Application
With the authentication token in hand, you will use Python and the Striim REST API to create a Striim application. This application will serve as the bridge between the Oracle database and Databricks.
The provided code creates a Striim application named InitialLoad_OracleToDatabricks to migrate the DMS_SAMPLE.NBA_SPORTING_TICKET Oracle table.
The code sets the necessary headers for the HTTP request using the authentication token obtained earlier. It retrieves the Oracle database and Databricks credentials from the environment variables.
Using the retrieved credentials, the code defines the application data, specifying the source as the Oracle database using the Global.DatabaseReader adapter, and the target as Databricks using the Global.DeltaLakeWriter adapter. More information of the Delta Lake Writer adapter can be found here: https://www.striim.com/docs/en/databricks-writer.html
After formatting the application data with the credentials and configuration details, the code sends a POST request to the Striim tungsten endpoint to create the application.
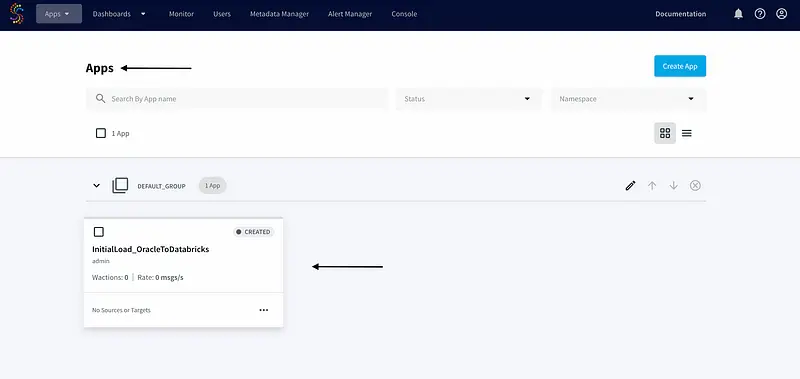
To verify that it was created successfully, we will log in to the Striim console and go to the “Apps” page:
Step 3: Deploy and Start the Striim Application
Once the Striim application is created, we will deploy and start it using the following HTTP POST requests:
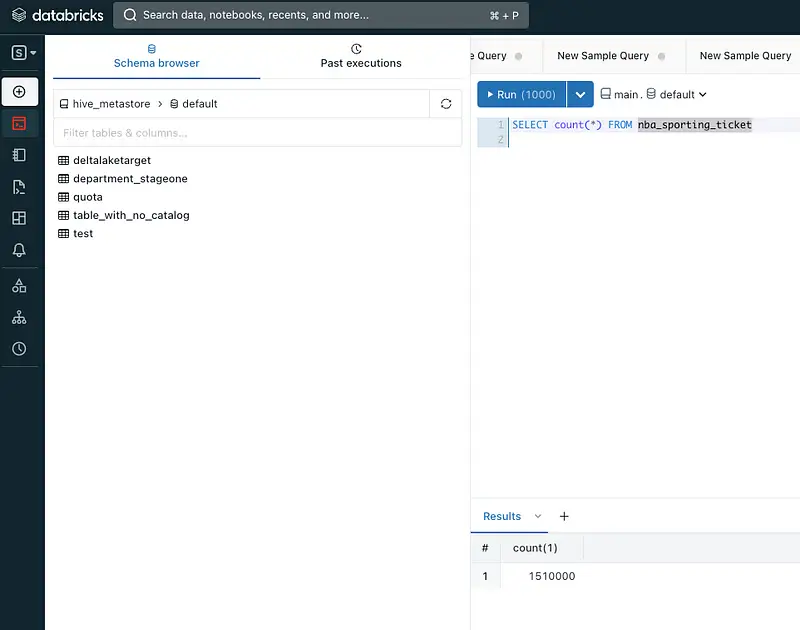
If the Total Output and Input values are equal, it indicates the successful migration of Oracle data to the Databricks catalog. To further validate the completeness of the migration, execute the following query in the Databricks editor to verify the total count of our NBA_SPORTING_TICKET table:
Conclusion
In conclusion, this comprehensive guide has walked you through the process of migrating data from an on-premise Oracle database to the Databricks Unity Catalog using Databricks Notebook and Python. By leveraging the power of Striim and its REST API, we were able to seamlessly establish connectivity between the Oracle database and Databricks. Through the step-by-step instructions and code snippets provided, you have learned how to generate an authentication token, create a Striim application, and deploy it to facilitate the data transfer process. With the integration of Databricks’ data processing capabilities and the centralized data catalog provided by the Unity Catalog, organizations can unlock data agility and enable streamlined data integration.
Wrapping Up: Start your Free Trial Today
In this recipe, we have walked you through steps for migrating on-premise Oracle Data to Databricks Unity Catalog with Python and Databricks Notebook. You can easily set up a streaming app by configuring your Databricks target. As always, feel free to reach out to our integration experts to schedule a demo, or try Striim developer for free here.
Tools you need
Striim
Striim’s unified data integration and streaming platform connects clouds, data and applications.
Databricks
Databricks combines data warehouse and Data lake into a Lakehouse architecture
Python
Python is a high-level, general-purpose programming language. Its design philosophy emphasizes code readability with the use of significant indentation via the off-side rule.
Striim for Snowflake: Real-time streaming ingest for Snowflake
Turn Snowflake into a real-time source of truth with Striim
Benefits
Operational Analytics Use non-intrusive CDC to Kafka to create persistent streams that can be accessed by multiple consumers and automatically reflect upstream schema changes
Empower Your TeamsGive teams across your organization a real-time view of your Oracle database transactions.Get Analytics-Ready DataGet your data ready for analytics before it lands in the cloud. Process and analyze in-flight data with scalable streaming SQL.
On this page
Introduction
Striim for Snowflake combines the power of fast data streaming with the simplicity of fully automated, ELT (Extract-Load-Transform) data integration to replicate databases to Snowflake in real-time.
Striim for Snowflake is also the only automated data integration product that leverages Snowflake’s new Snowpipe Streaming API to provide fast, cost-optimized data ingest.
You can try Striim for Snowflake yourself by signing up for a 14-day free trial with $1,000 worth of free credits included.
Follow this step-by-step guide to configure your data streaming pipeline in snowflake for Striim.
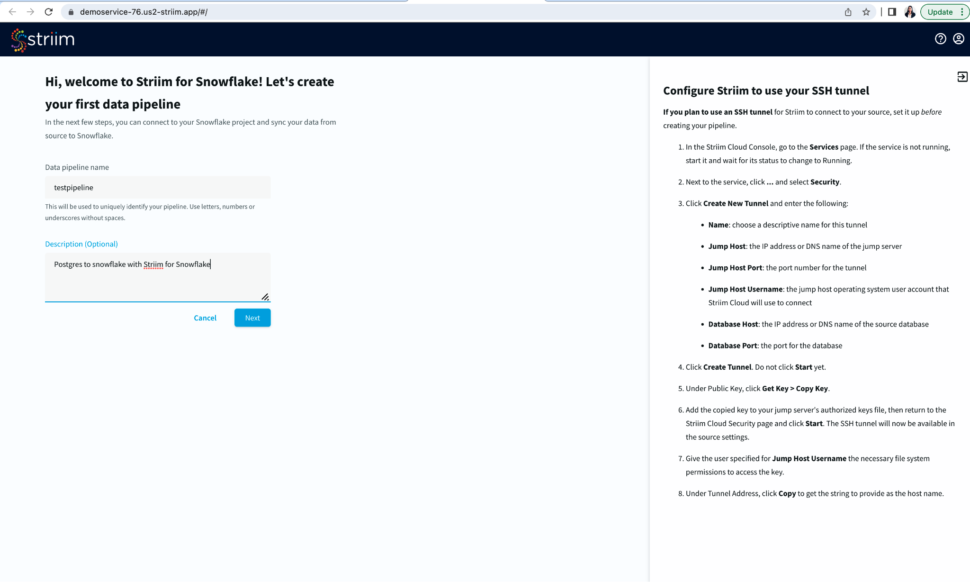
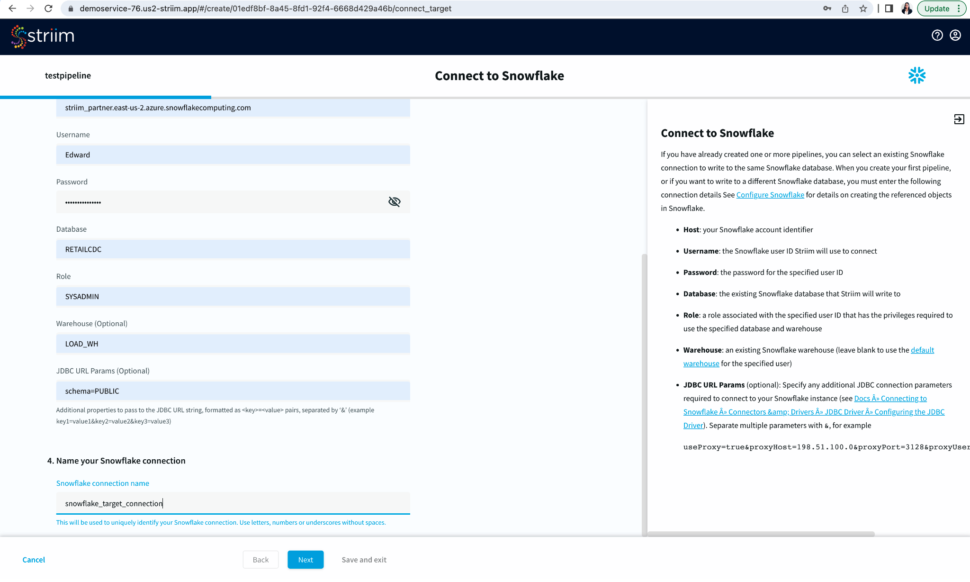
Step 1: Configure your snowflake target connection
To start building your data pipeline, first name your pipeline, and optionally add a description.
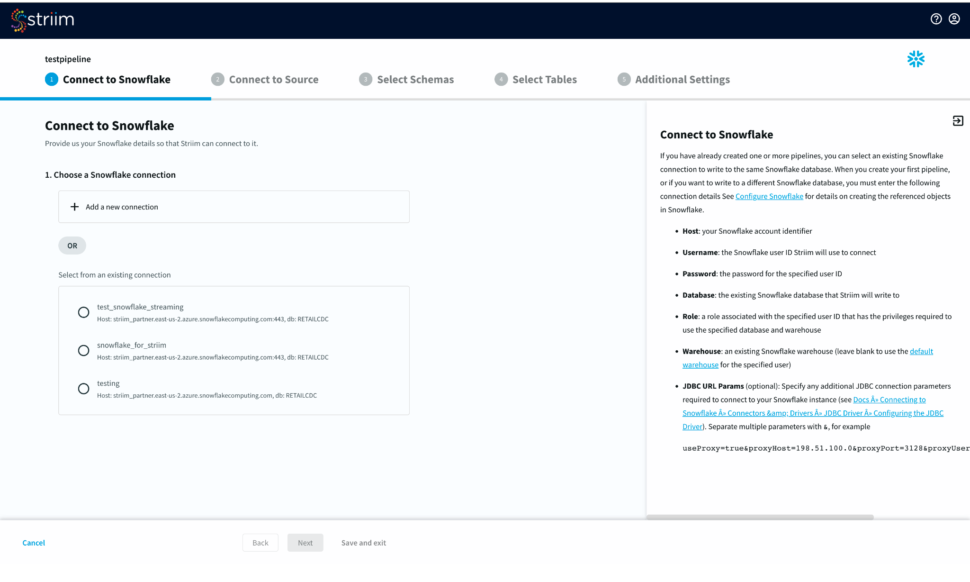
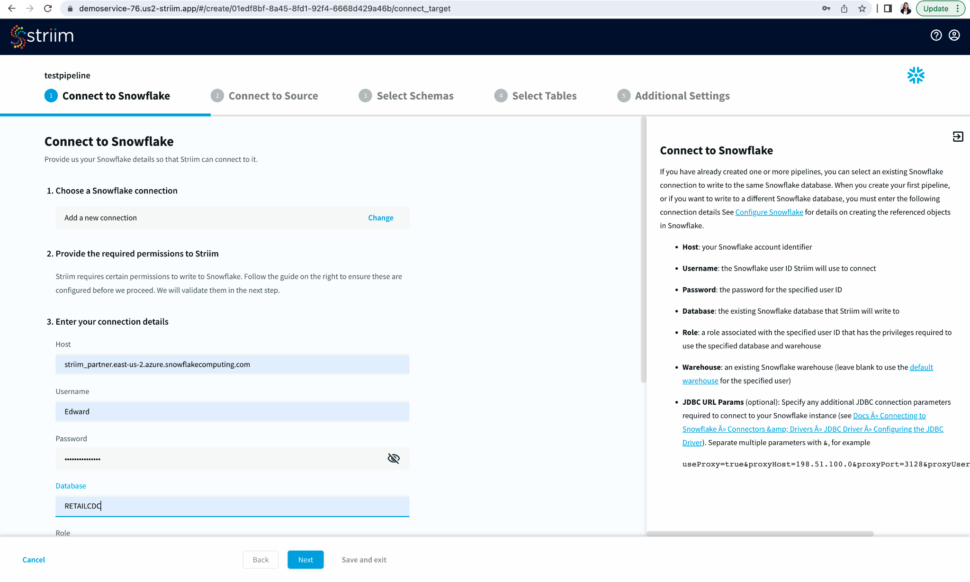
Select an existing connection or add a new connection from scratch by adding hostname or account identifier, username and password for your snowflake account, target database, role associated with the user id, snowflake warehouse associated with the specified user, and any additional properties in the jdbc string in <key>=<value> format separated by ‘&’.
Name your snowflake connection. Striim saves these connection details under the connection name for future use.
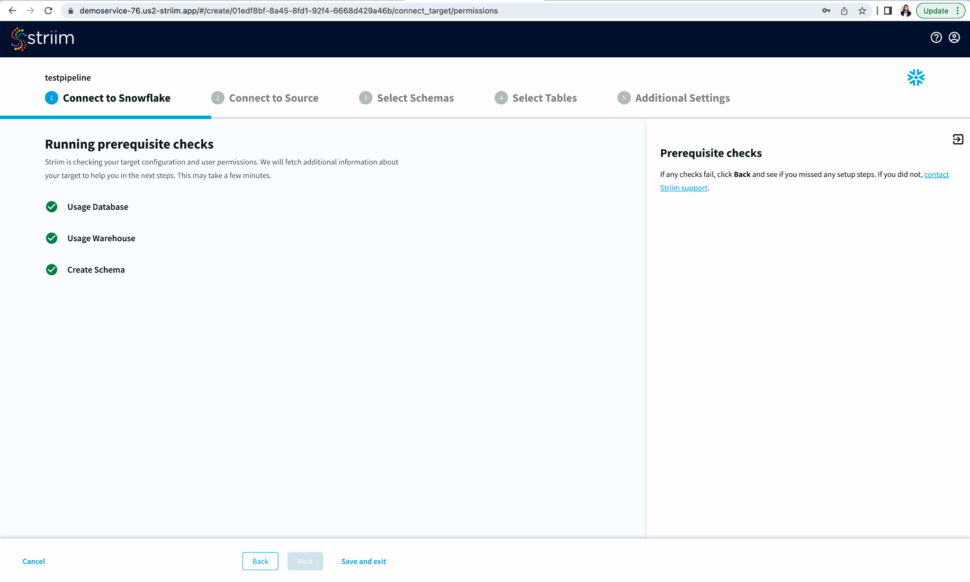
After you have entered your connection details, click Next. Striim will check if all the prerequisites have been met.
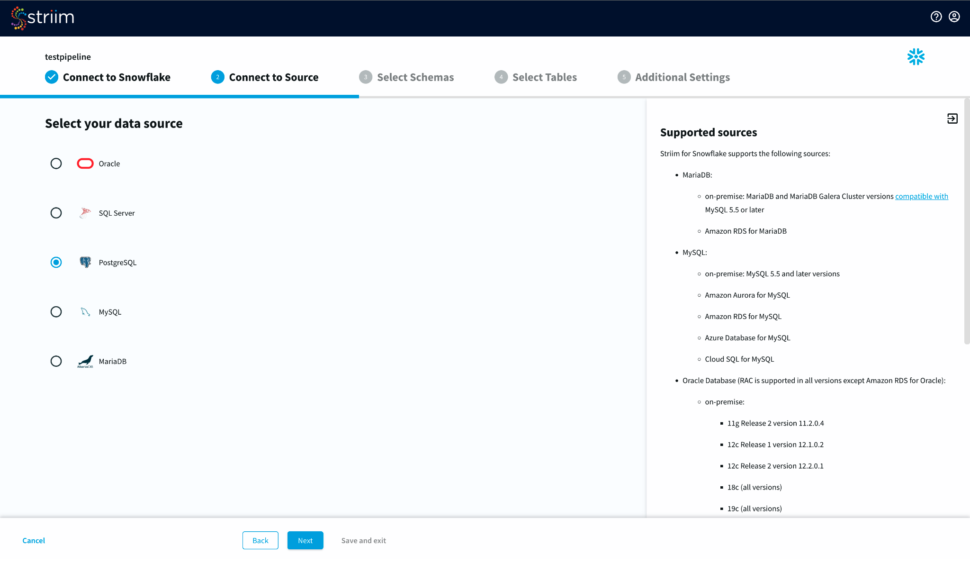
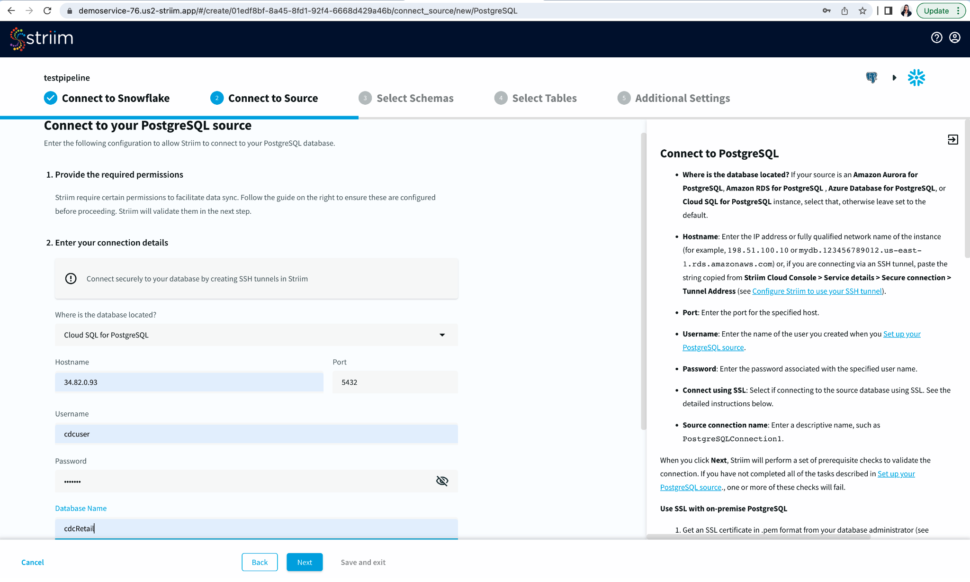
Step 2: Configure your Source connection
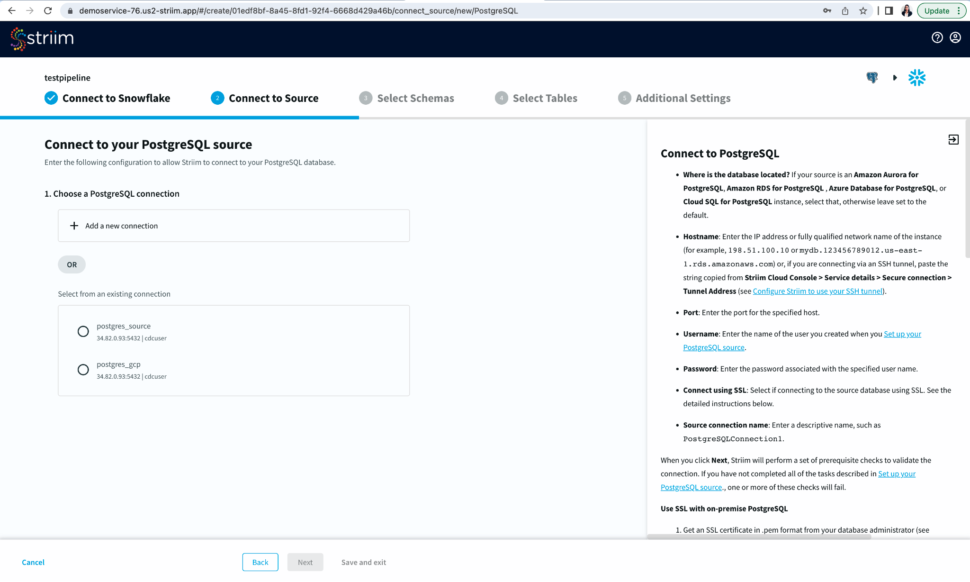
Once your target connection is verified, configure your source connection by selecting your source database. Here, we have selected postgreSQL as our data source.
Select an existing connection or add a new connection. Enter the hostname, username, password and database name. You can also connect securely by using SSH tunnel
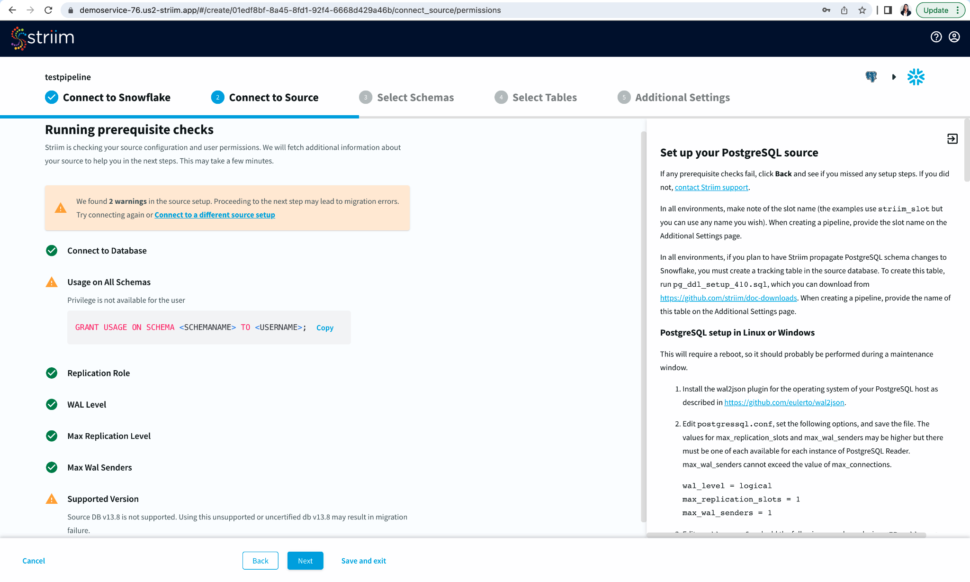
Now Striim will run prerequisite checks to verify source configuration and user permissions.
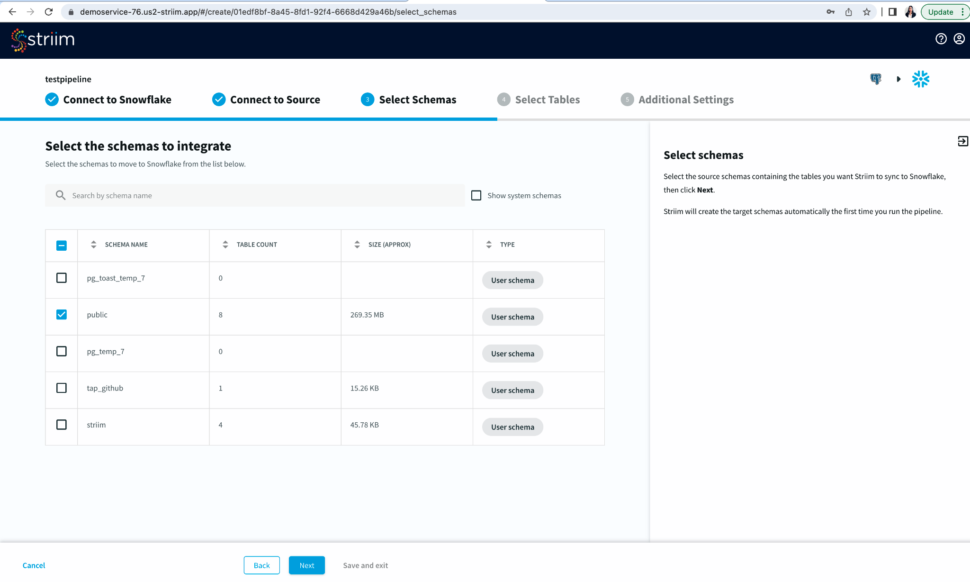
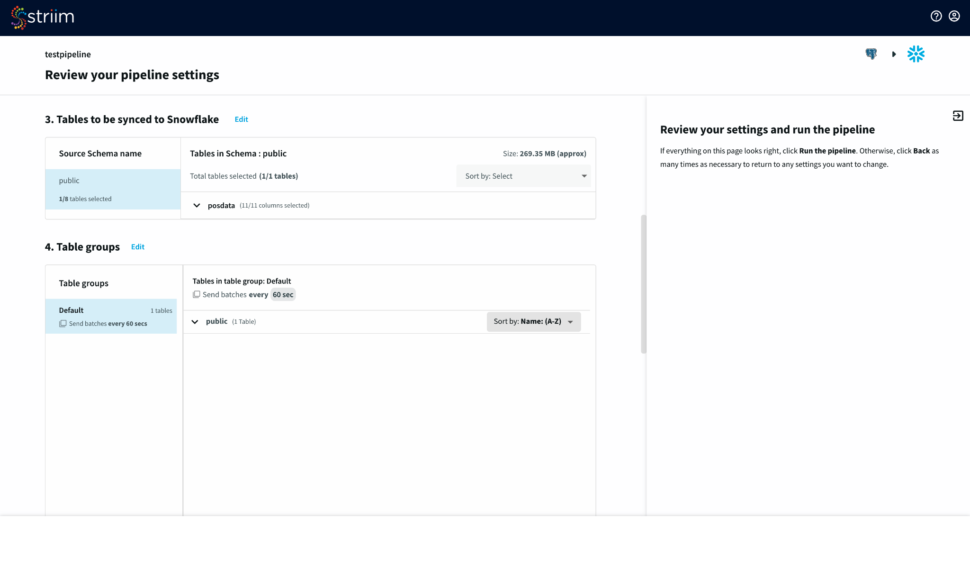
Step 3: Select Schema and Tables to move into the target
Select the source schemas containing the tables you want to sync with Snowflake.
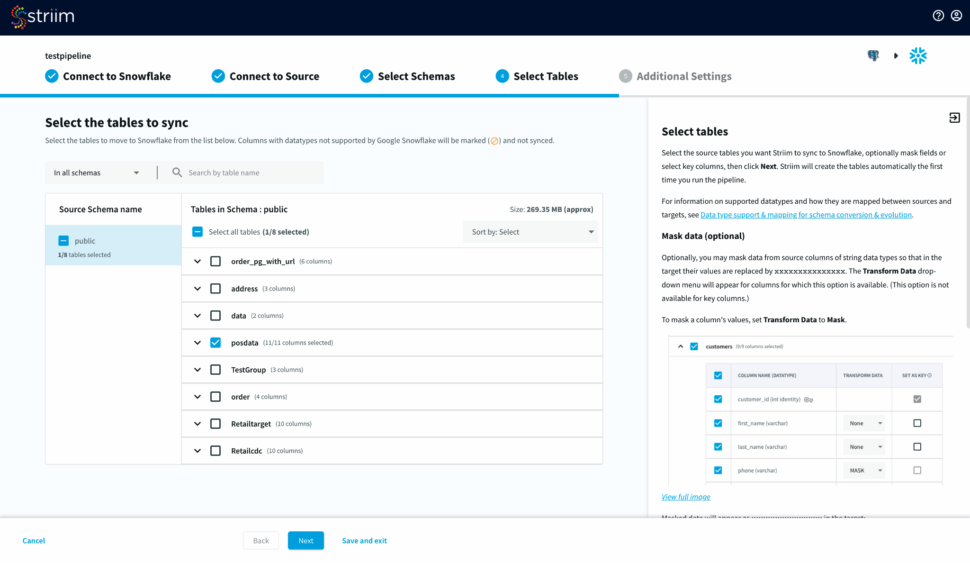
Next, select the tables, optionally you can mask fields or select key columns.
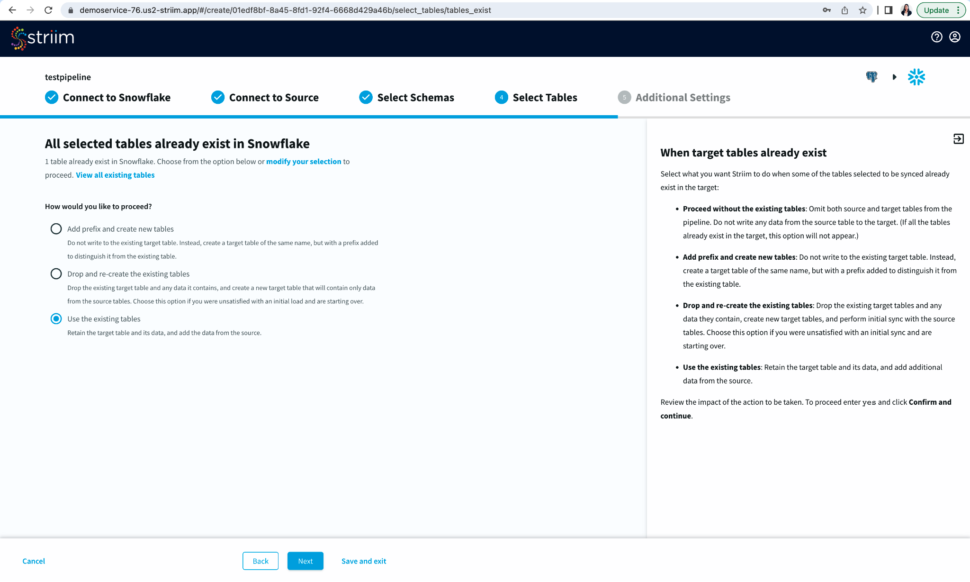
Striim will now check the target warehouse and give you the option to sync with existing tables or create a new table.
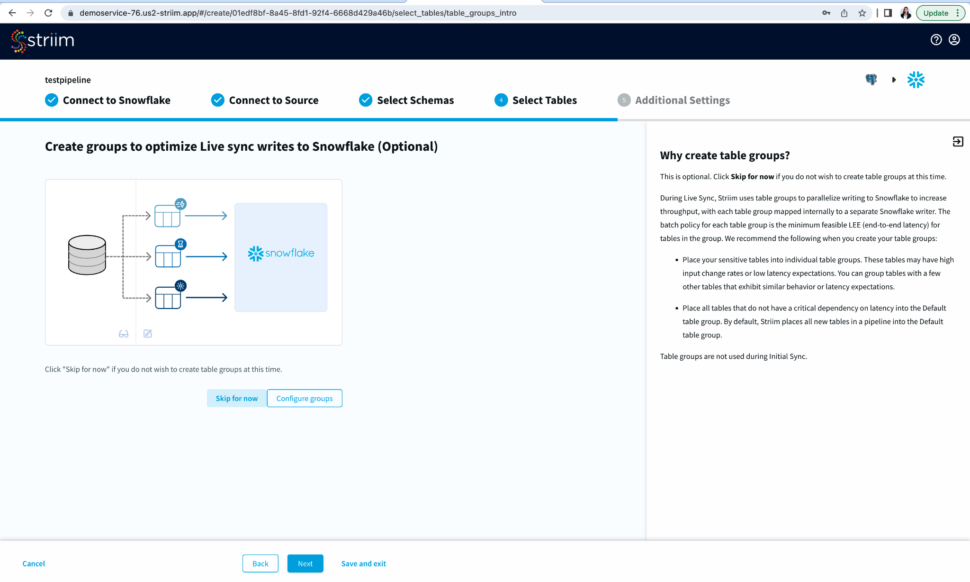
You have the option to create table groups based on input change rates and low latency expectations.
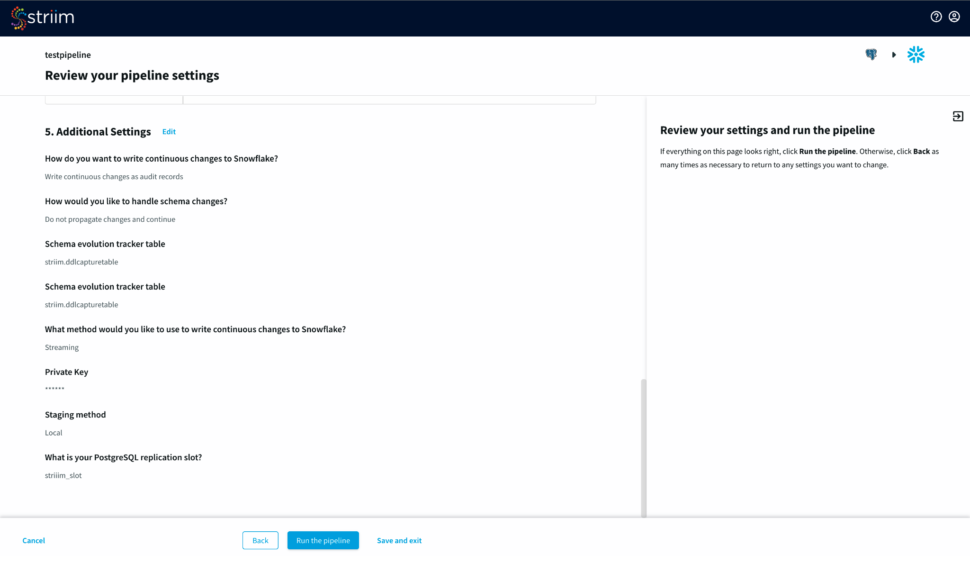
Step 4: Input Additional Settings to complete your CDC pipeline
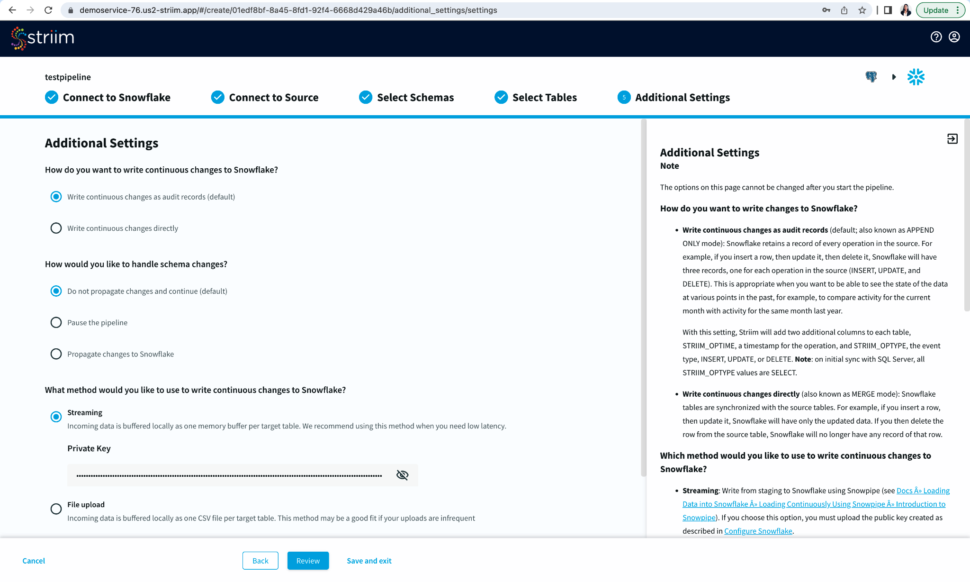
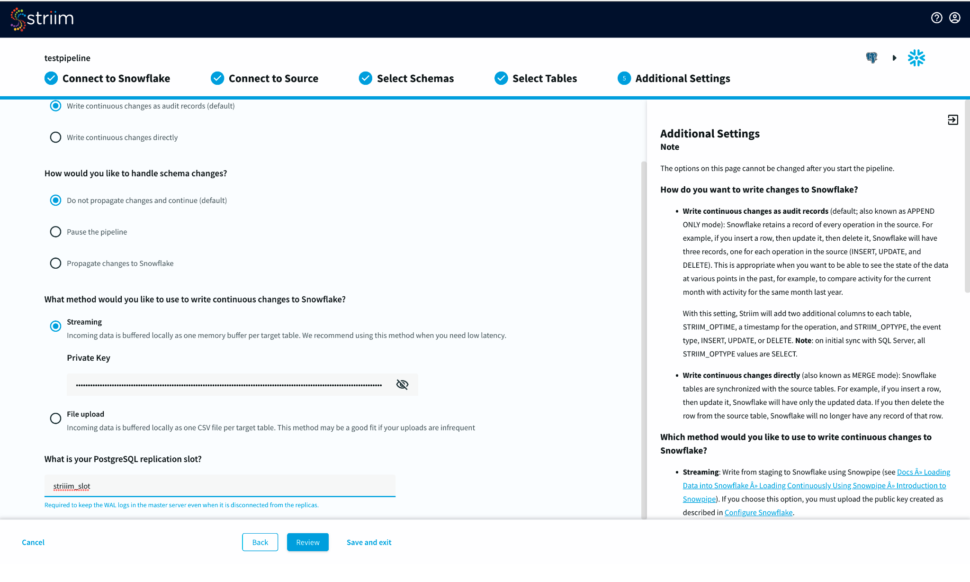
You have options to write changes as audit records or directly to your target table. You can specify how you want to handle schema changes. For streaming option, enter the private key associated to the public key of your Snowflake user id.
For the source database, enter your postgreSQL replication slot that is required to keep the WAL logs in the master server.
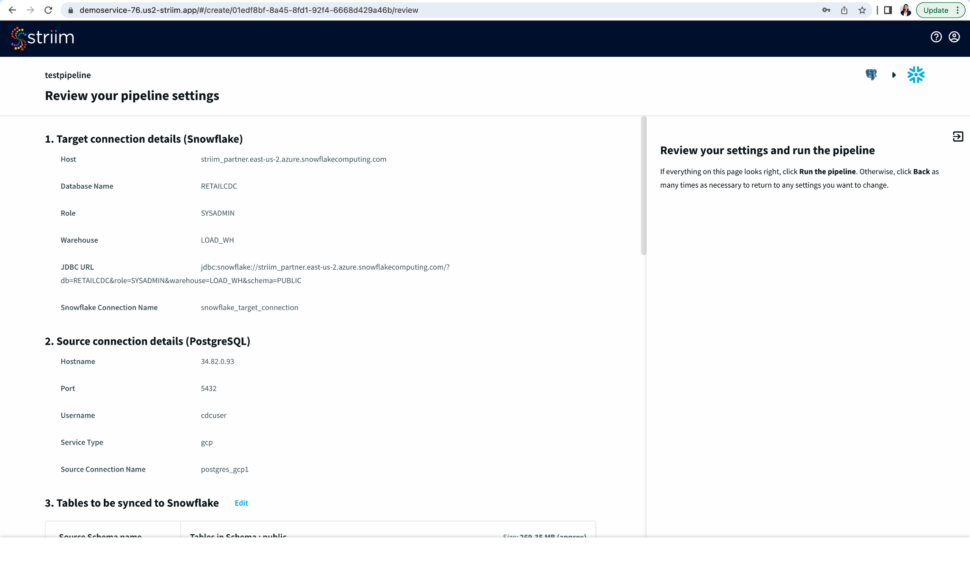
Step 5: Review your Pipeline
Review your source and target connection before running the pipeline. Make sure that your source and target connection details, selected tables and additional settings are correct.
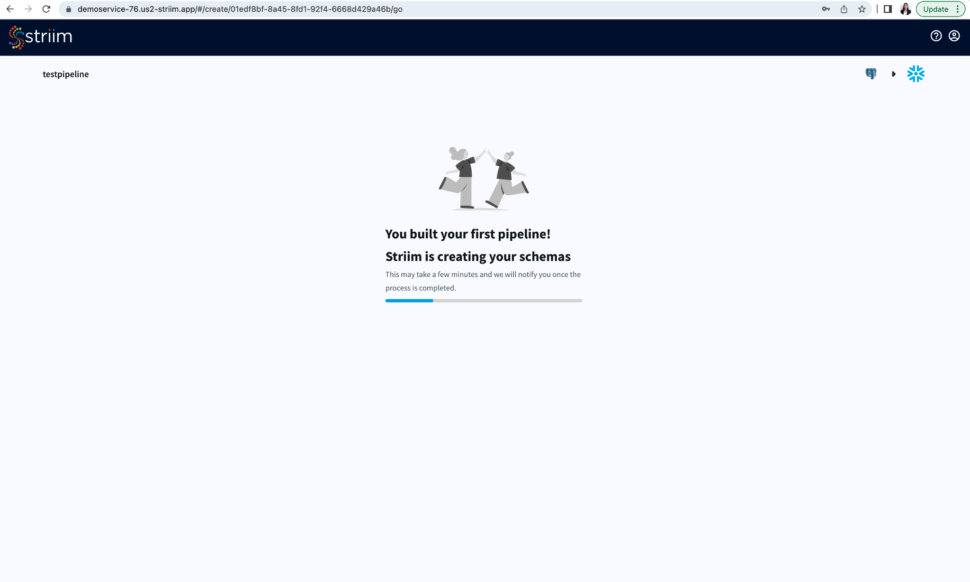
Step 6: Run your pipeline to sync the source and target tables and stream data from your source
After you have reviewed your pipeline, run your pipeline to sync the table from your source with the target followed by data streaming.
Tools you need
Striim
Striim’s unified data integration and streaming platform connects clouds, data and applications.
Oracle Database
Oracle is a multi-model relational database management system.
Apache Kafka
Apache Kafka is an open-source distributed streaming system used for stream processing, real-time data pipelines, and data integration at scale.
Azure Cosmos
Azure Cosmos is a fully managed NoSQL database.
Azure Blob Storage
Azure Blob Storage is an object store designed to store massive amounts of unstructured data.
Build Smart, Real-Time Data Pipelines for OpenAI using Striim
Striim transforms data from hundreds of sources into real-time streams for OpenAI
Benefits
Get Started with Streaming
Learn how to play with real-time streams with simple auto-generated data streams
Real-Time Ingest for OpenAI
Enable true real-time ingest using openai API to build smart AI modelsConvert Training data to JSONL format Use Striim’s Continuous Query to process data into desired format
On this page
Overview
JSON data format can be particularly useful for preparing AI training data due to its ease of transfer and data manipulation, allowing for easy summarization of relevant information as part of the prompt. OpenAI accepts the prompt-completion format, also known as JSON line format, for training models. Data preparation is a crucial aspect of creating AI models, and converting JSON to JSON line format is the first step. While Python is typically used to convert dataset formats, for large datasets and production environments, it may not be the most efficient tool.
Striim is a unified real-time data streaming and integration product that enables continuous replication from various data sources, including databases, data warehouses, object stores, messaging systems, files, and network protocols. The Continuous Query (CQ) component of Striim uses SQL-like operations to query streaming data with almost no latency.
In this recipe, we read a JSON file of grocery and gourmet food reviews from a S3 bucket and processed it using a CQ to generate prompt-completion pairs as input for OpenAI model training. To recreate the Striim application, follow this tutorial. To try Striim for free, sign up for the developer version here. With Striim Developer, you can prototype streaming use cases for production use at no upfront cost, stream up to 10 million events per month with unlimited Streaming SQL queries, and simulate real-time data behavior using Striim’s synthetic continuous data generator.
Background
OpenAI is an artificial intelligence research laboratory that was established with the goal of promoting and developing friendly artificial intelligence. Initially, it operated as a non-profit organization that allowed for free collaboration with institutions and researchers by making its patents and research open to the public. However, as artificial intelligence gained more traction and with investments from major industries like Microsoft, OpenAI transitioned from a non-profit to a for-profit organization, with its profits capped at 100 times any investment.
One of OpenAI’s notable developments is the Generative Pre-trained Transformer-3 (GPT-3), a machine learning-driven language model that generates human-like text using pre-trained algorithms. The latest milestone in OpenAI’s efforts to scale up deep learning is the GPT-4 model, which accepts both image and text inputs and produces text outputs that exhibit close to human-level performance on various professional and academic benchmarks.
Natural Language Generation (NLG) is a domain that is responsible for converting structured data into meaningful phrases in natural language form. GPT-3 has been called “the next generation of NLG” due to its ability to understand data, extract meaning, and identify relationships between data points that can be communicated in plain English, which is an open-source and free tool.
There are numerous use cases where OpenAI can positively impact businesses. Developers can use the OpenAI API to create applications for chatbots, content creation, customer service, and more. However, an important aspect of using OpenAI is training the built-in models with training data. A vast amount of data is generated every day, most of which is unstructured. OpenAI expects its training data in Jsonl format, which consists of a prompt-completion pair. Striim’s CQ component can be used to easily convert real-time data from JSON to JSONL format, making Striim a valuable tool in the pipeline.
Why Striim
Striim offers a straightforward, unified data integration and streaming platform that combines change data capture (CDC), application integration, and Streaming SQL as a fully managed service.
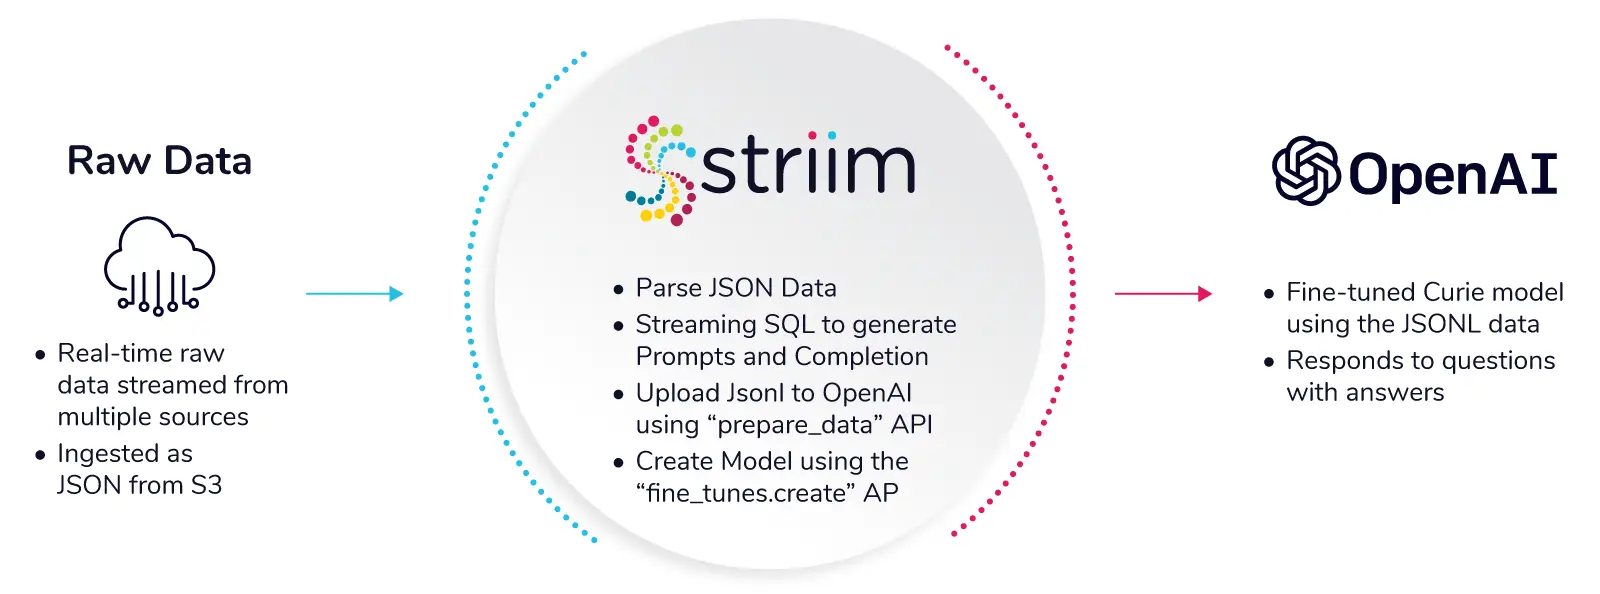
Striim can be used for OpenAI by parsing any type of data from one of Striim’s 100+ streaming sources into the JSONL format, which can be easily uploaded to OpenAI for model creation. The following steps can be taken to use Striim for OpenAI:
Set up a Striim account and connect to the data source from which you want to extract data.
Use Striim’s Continuous Query (CQ) component to query streaming data using SQL-like operations and parse the data into JSONL format.
Save the parsed data into a file and upload it to OpenAI for model creation.
It’s important to note that the specific steps involved in using Striim for OpenAI may depend on the particular use case and data source. However, Striim’s ability to parse data into JSONL format can be a valuable tool in preparing data for OpenAI model creation.
In this use case, Striim parses data into JSONL format, which can then be uploaded to OpenAI for model creation.
Core Striim Components
S3 Reader: The S3 Reader source reads from an Amazon S3 bucket with the output type WAEvent except when using the Avro Parser or JSONParser.
Continuous Query: Striim’s continuous queries are continually running SQL queries that act on real-time data and may be used to filter, aggregate, join, enrich, and transform events.
File Writer: Writes files to disk using a compatible parser.
Step 1: Configure your source containing raw data
Please find the app TQL file (passphrase: striimrecipes) from our github repository to directly upload into the flow designer and edit the source and target configuration.
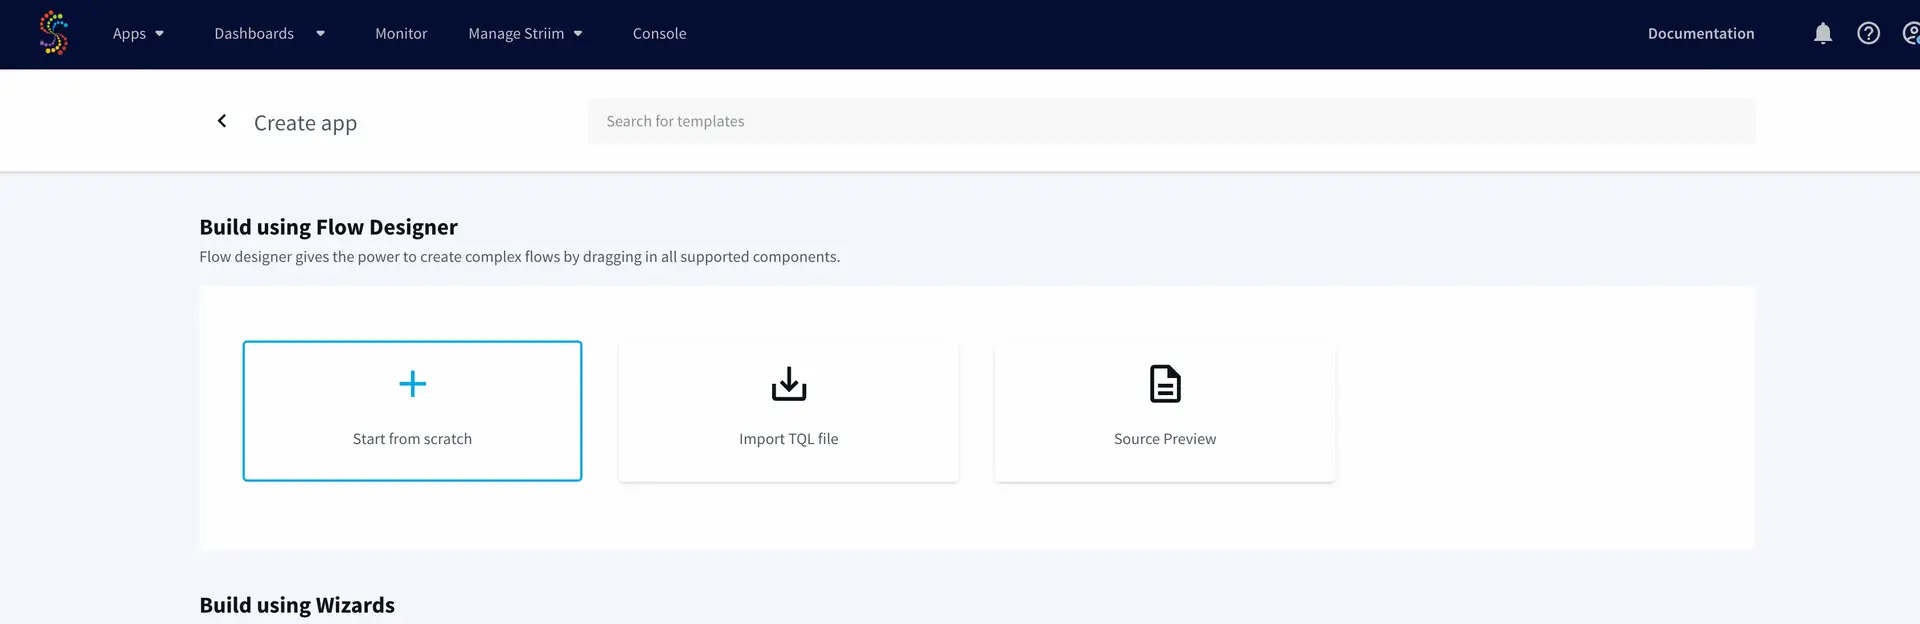
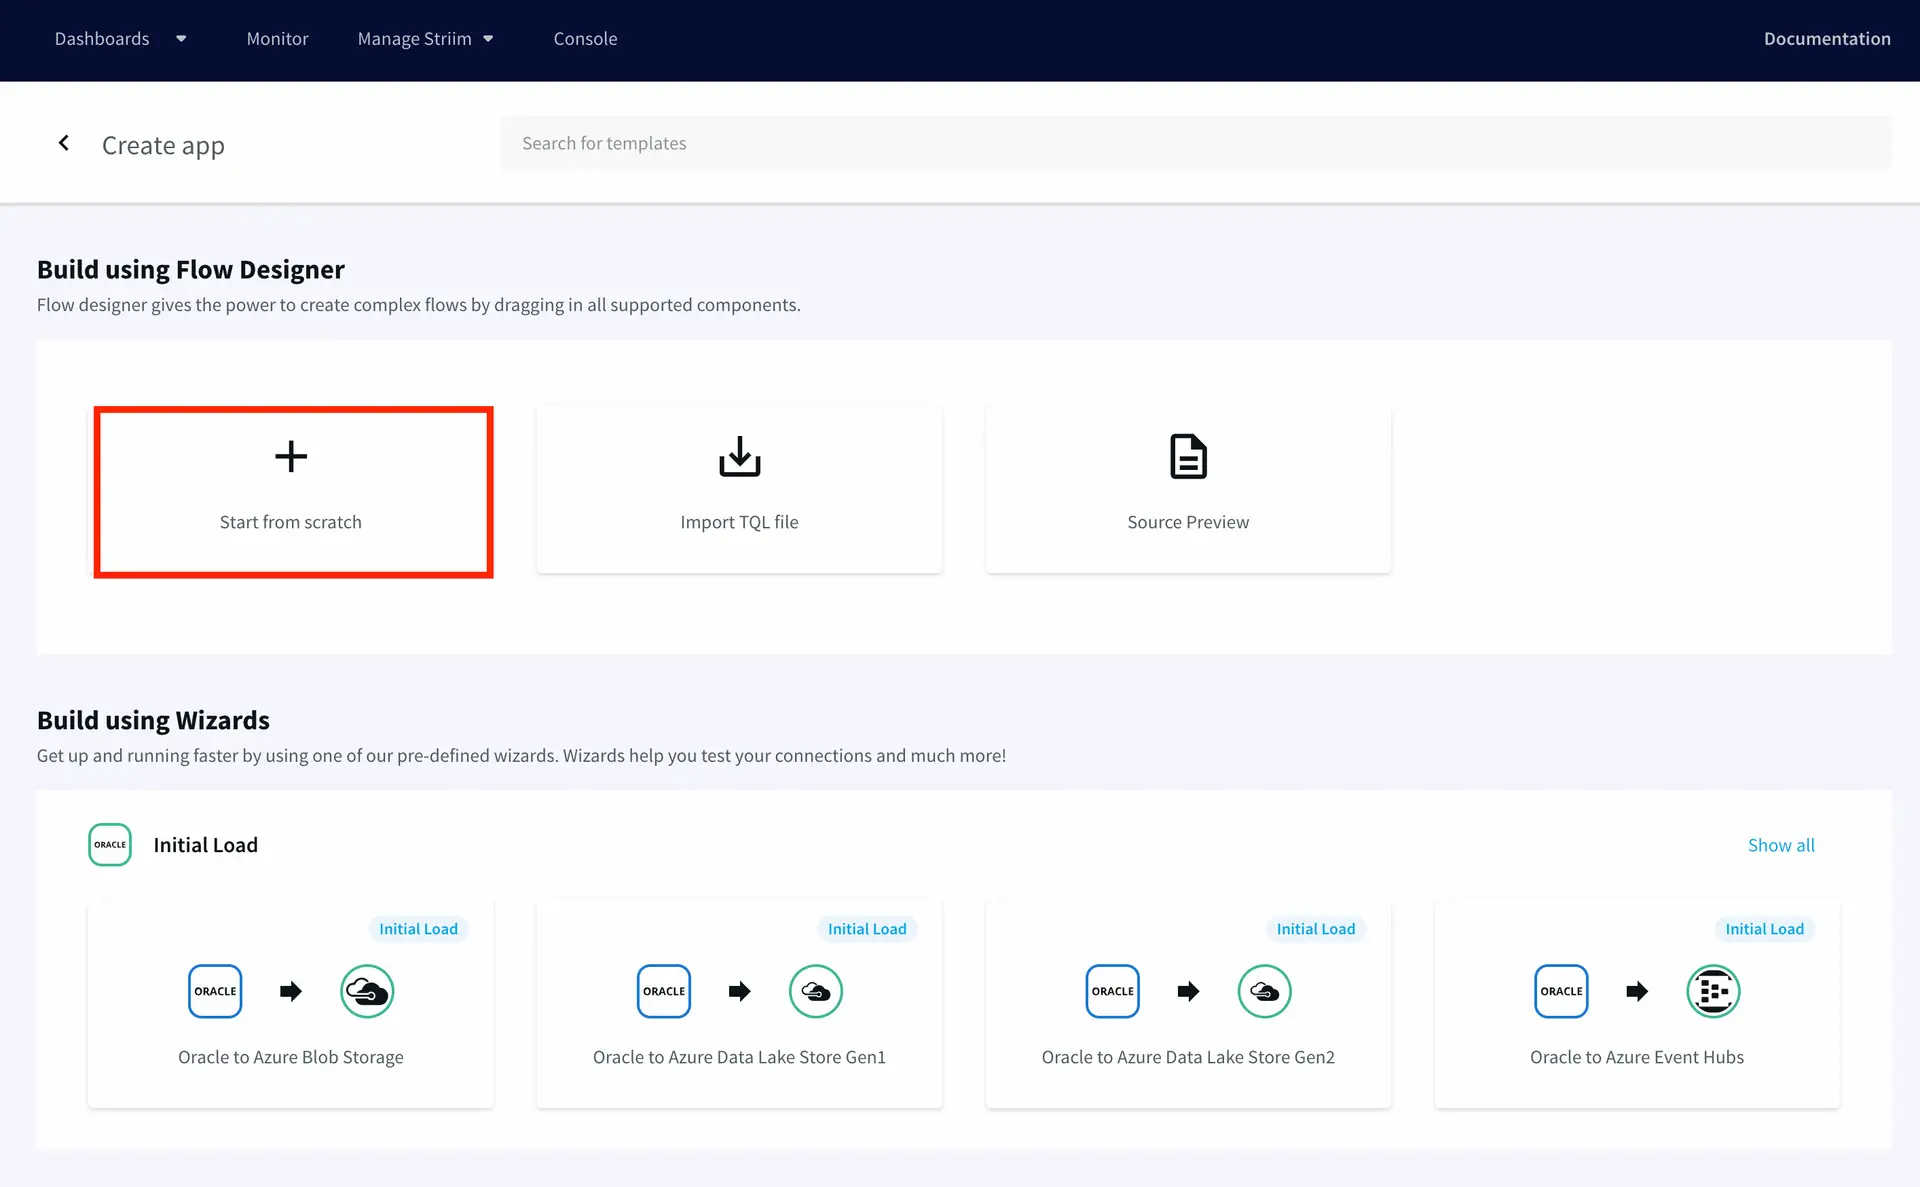
For this recipe, we have read raw data in JSON format from S3 bucket. If needed, please create an IAM user that can access your S3 bucket. If you already have your source set up, go to your homepage. Click create app followed by ‘Start from scratch’ under ‘Build using Flow Designer’
Name your app and click save. You will be redirected to the Flow Designer. Select S3 Reader source from the list of components on the left and enter your S3 bucket name, Object name and choose a relevant parser. For this use-case we have a JSON file, hence a JSONParser is chosen. You can find the JSON file in our github repository.
Step 2: Write the Continuous Query to convert JSON data into Prompt and Completion
A JSON file can be parsed to JSONL using Python but it is a lengthy process compared to creating a pipeline using Striim’s CQ component. Drag a CQ component from the list of components on the left and enter the following query:
SELECT (‘ReviewerID=’ + data.get(‘reviewerID’).textValue() + “, ” + ‘asin=’ + data.get(‘asin’).textValue()+ “, ” + ‘rating=’ + data.get(‘overall’)) as prompt, data.get(‘reviewText’).textValue() as completion FROM groceryStream j
The above query will continuously parse the incoming raw data into Jsonl format that has a prompt and completion.
Step 3: Read the parsed data and upload to OpenAI using relevant APIs
In this step we read the JSONL file and upload it into OpenAI for model creation. For this demo, we have written the parsed data with fileWriter and uploaded it to OpenAI using “prepare_data” API and trained with curie model/engine using “fine_tunes.create” API. This entire pipeline can be automated with custom Java functions or Open Processors.
For the fileWriter component, specify the filename, directory which is the path of the output file, ROLLOVER and FLUSH Policies and the formatter.
Step 4: Running the Striim application
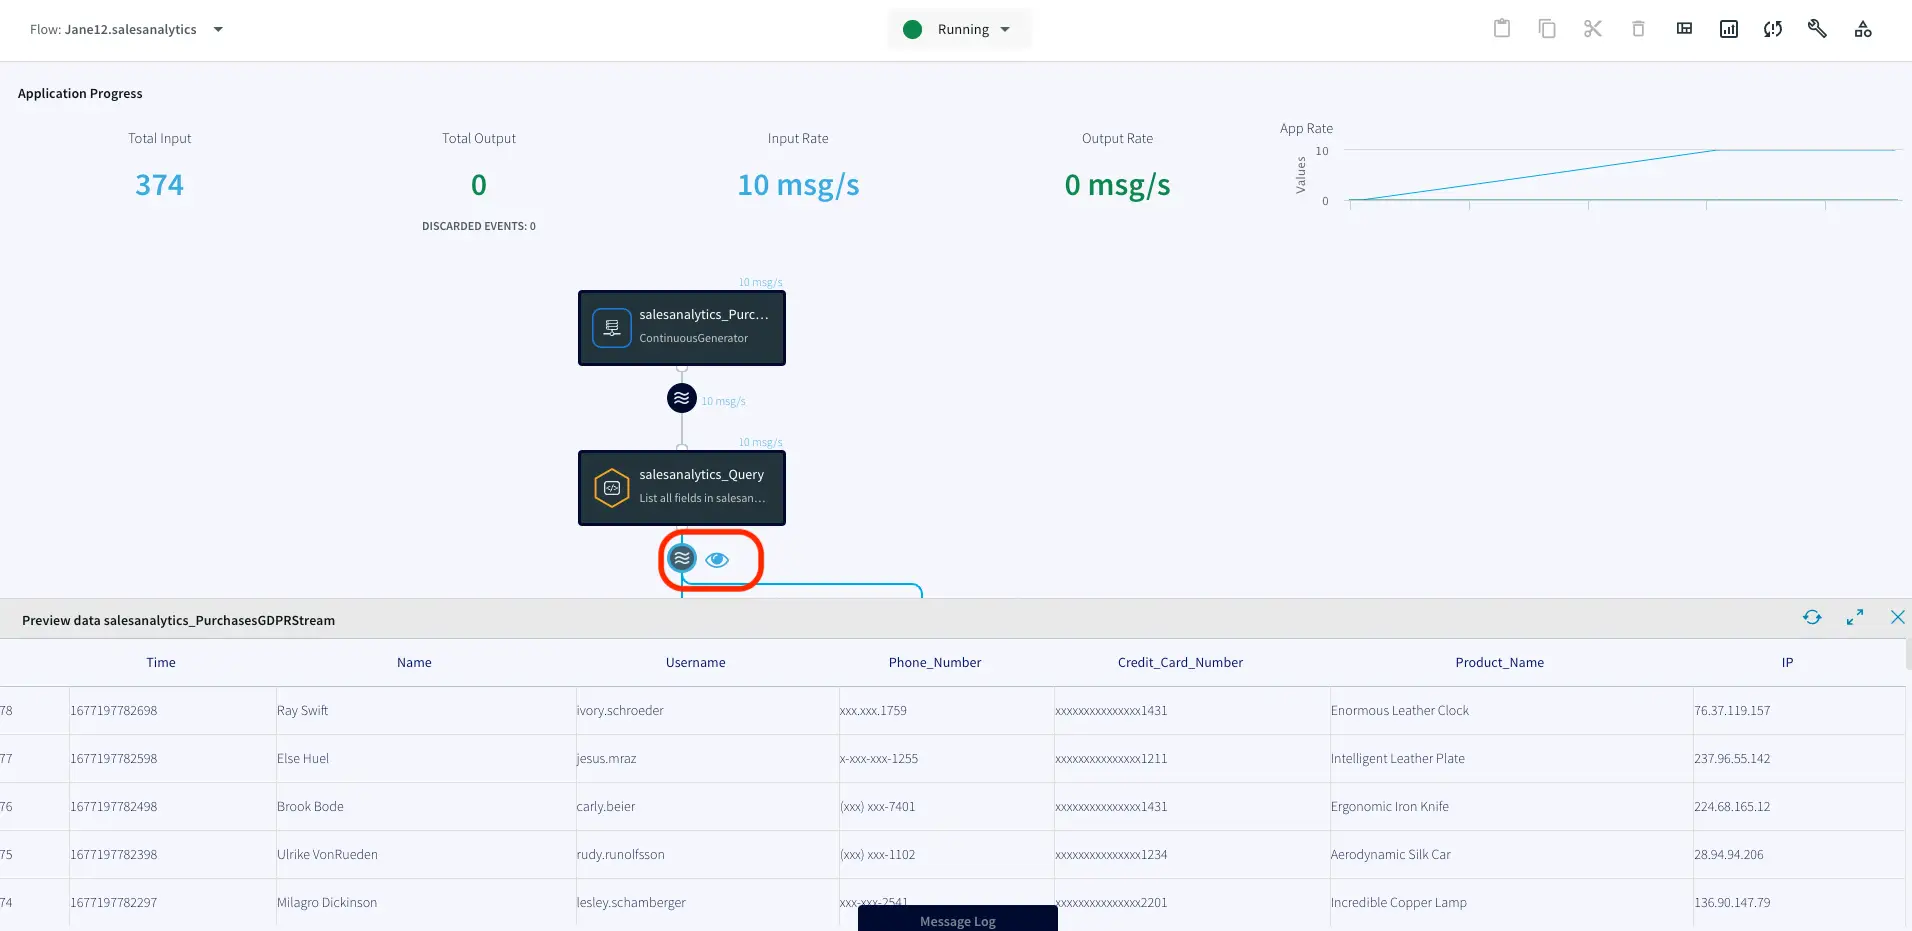
Click on Start from the dropdown menu to run your app. You can monitor your data by clicking on the eye wizard next to each stream.
Tuning the Model and Asking Questions
You can try out GPT-3 for three months of free credits if you do not have an account yet. For help with fine tuning your model, follow this link. After you have installed OpenAI locally and exported your account’s API key, you can access OpenAI from your CLI . Use fine_tunes.prepare_data API for training data preparation:
Next, create a fine-tuned model using fine_tunes.create API:
openai api fine_tunes.create -t <TRAIN_FILE_ID_OR_PATH> -m curie
The fine tuning job will take sometime. Your job may be queued behind another job, and training the model can take minutes or hours depending on the model and dataset size. If the event stream is interrupted for any reason, you can resume it by running:
openai api fine_tunes.follow -i <YOUR_FINE_TUNE_JOB_ID>
After the model is trained, you can start making requests by passing the model name as the model parameter of a completion request using completion.create API.
openai api completions.create -m <FINE_TUNED_MODEL> -p <YOUR_PROMPT>
OpenAI allows us to optimize algorithmic parameters that will increase the precision of the model. In this recipe, we have trained a basic AI model with grocery and gourmet food reviews. The model can be improved with larger datasets and hyperparameter tuning, and businesses can harness the real-time AI models for better decision-making. Here are some of the questions we asked our model:
Question 1: What are customers hating in coffee?
Question 2: What ingredients do I need to make a traditional panang curry?
Question 3: What spices are preferred in roast chicken?
Question 4: What is the most popular food item consumed?
Setting Up the Striim Application
Step 1: Create a S3 user with required permissions.
Step 2: Configure your source S3 reader. Enter access key and secret key for your user.
Step 3: Parse the source data stream to convert into JSONL format using Continuous Query.
Step 4: Configure the target to write the parsed data using FileWriter.
Step 5: Deploy and Run your real-time streaming application .
Step 6: Use OpenAI API to prepare and tune the data to build an AI model. The AI model responds to questions asked by users.
Wrapping Up: Start your Free Trial Today
Want to try this recipe out for yourself and experience the power of real-time data streaming and integration? Get started on your journey by signing up for Striim Developer or Striim Cloud. Dive into data streaming and analytics with ease and transform your decision-making today. With Striim Developer, you’ll have access to a free sandbox environment that allows you to experiment with Streaming SQL and Change Data Capture for up to 10 million events per month, free forever. It’s an ideal way to dive into the world of data streaming and real-time analytics without any upfront investment.
For those who need a more comprehensive solution, Striim Cloud is the perfect choice. As a fully managed SaaS solution — available on AWS, Google Cloud, and Microsoft Azure — Striim Cloud allows you to focus on building and optimizing your applications while we handle the complex data integration and streaming infrastructure management.
Tools you need
Striim
Striim’s unified data integration and streaming platform connects clouds, data and applications.
OpenAI
OpenAI is a private research laboratory that aims to develop and direct artificial intelligence (AI) in ways that benefit humanity as a whole.
Amazon S3
Amazon S3 is cloud object storage with industry-leading scalability, data availability, security, and performance.
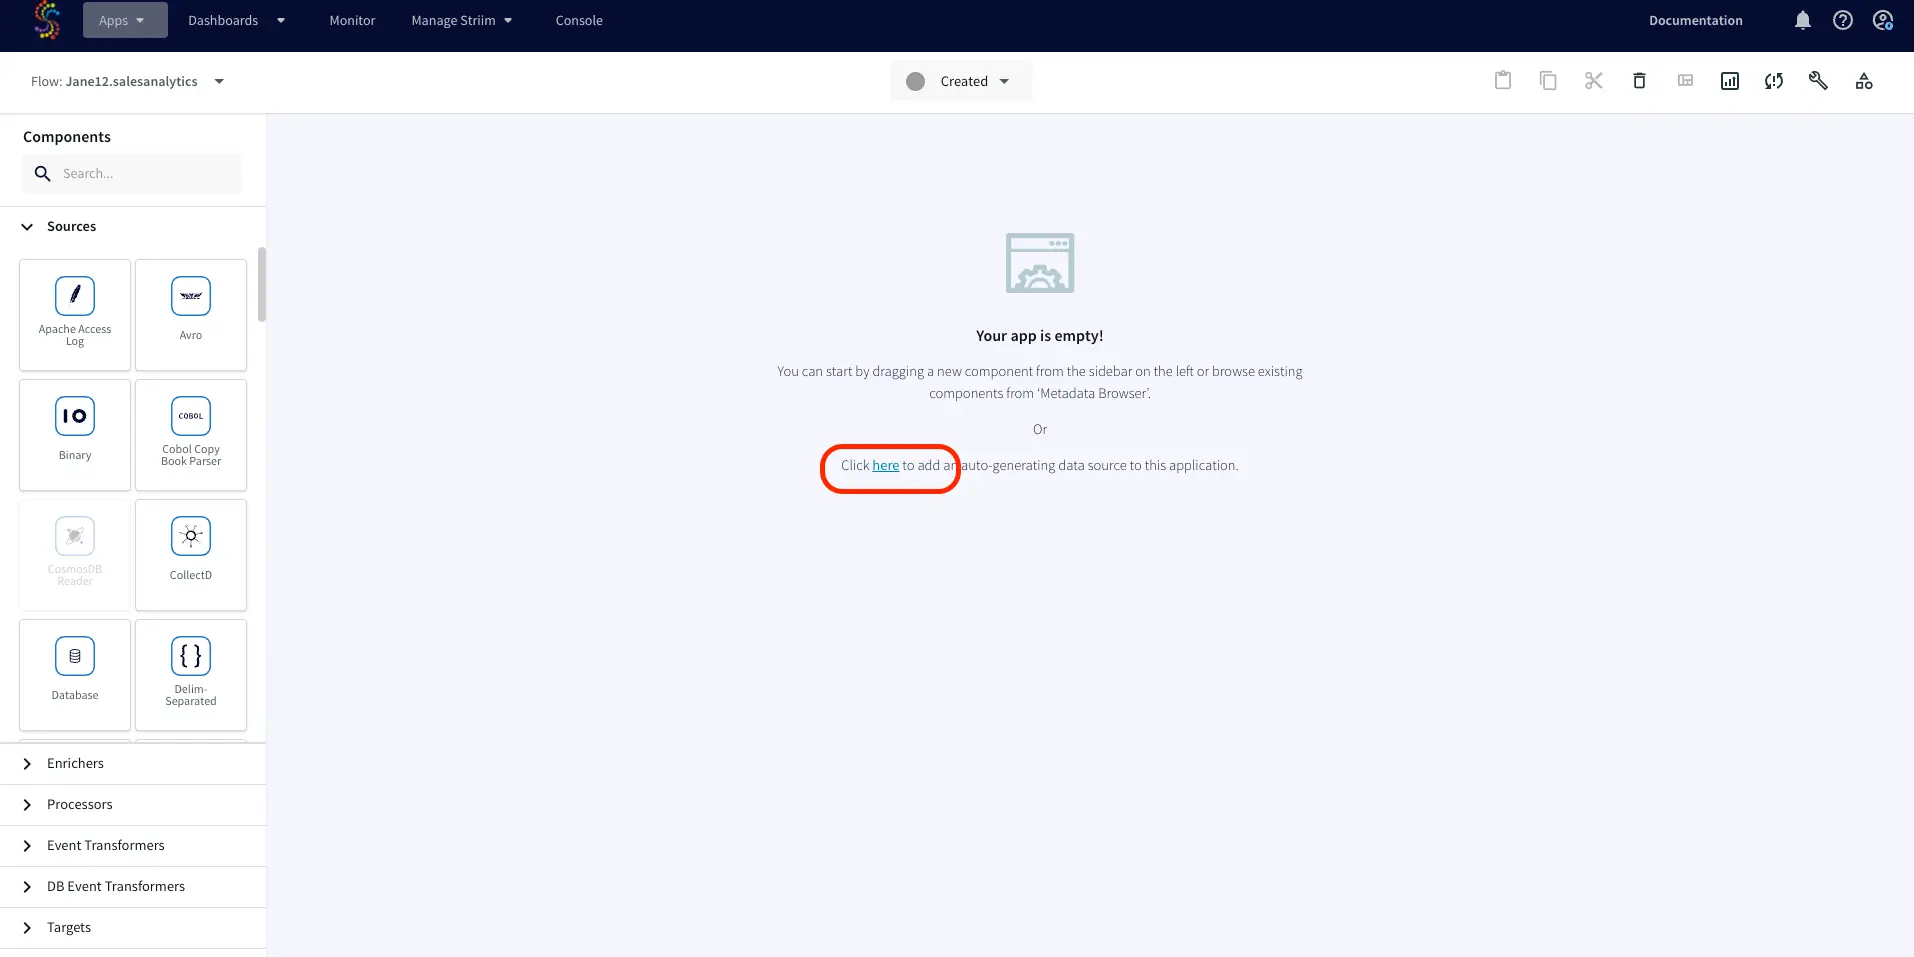
Go from zero to Streaming Analytics in a matter of clicks
Benefits
Get Started with Streaming
Learn how to play with real-time streams with simple auto-generated data streams
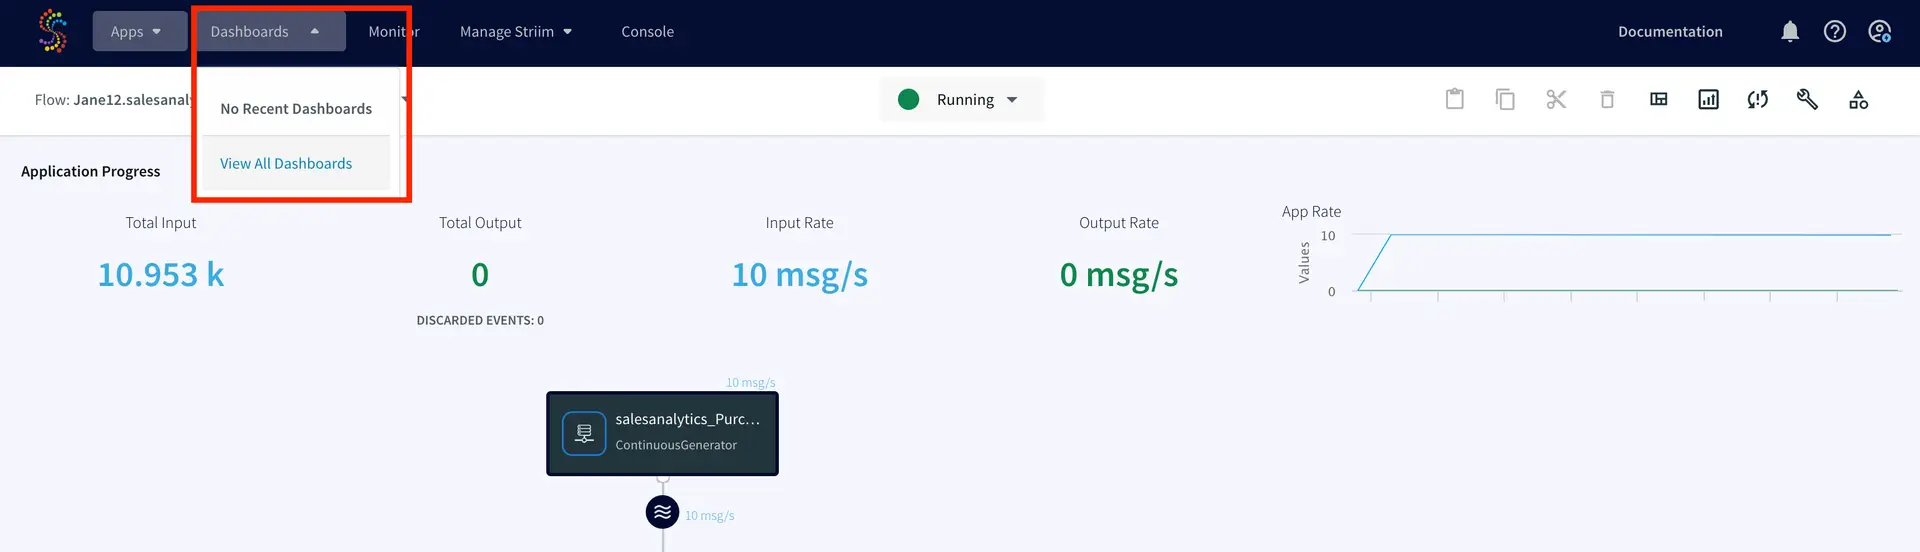
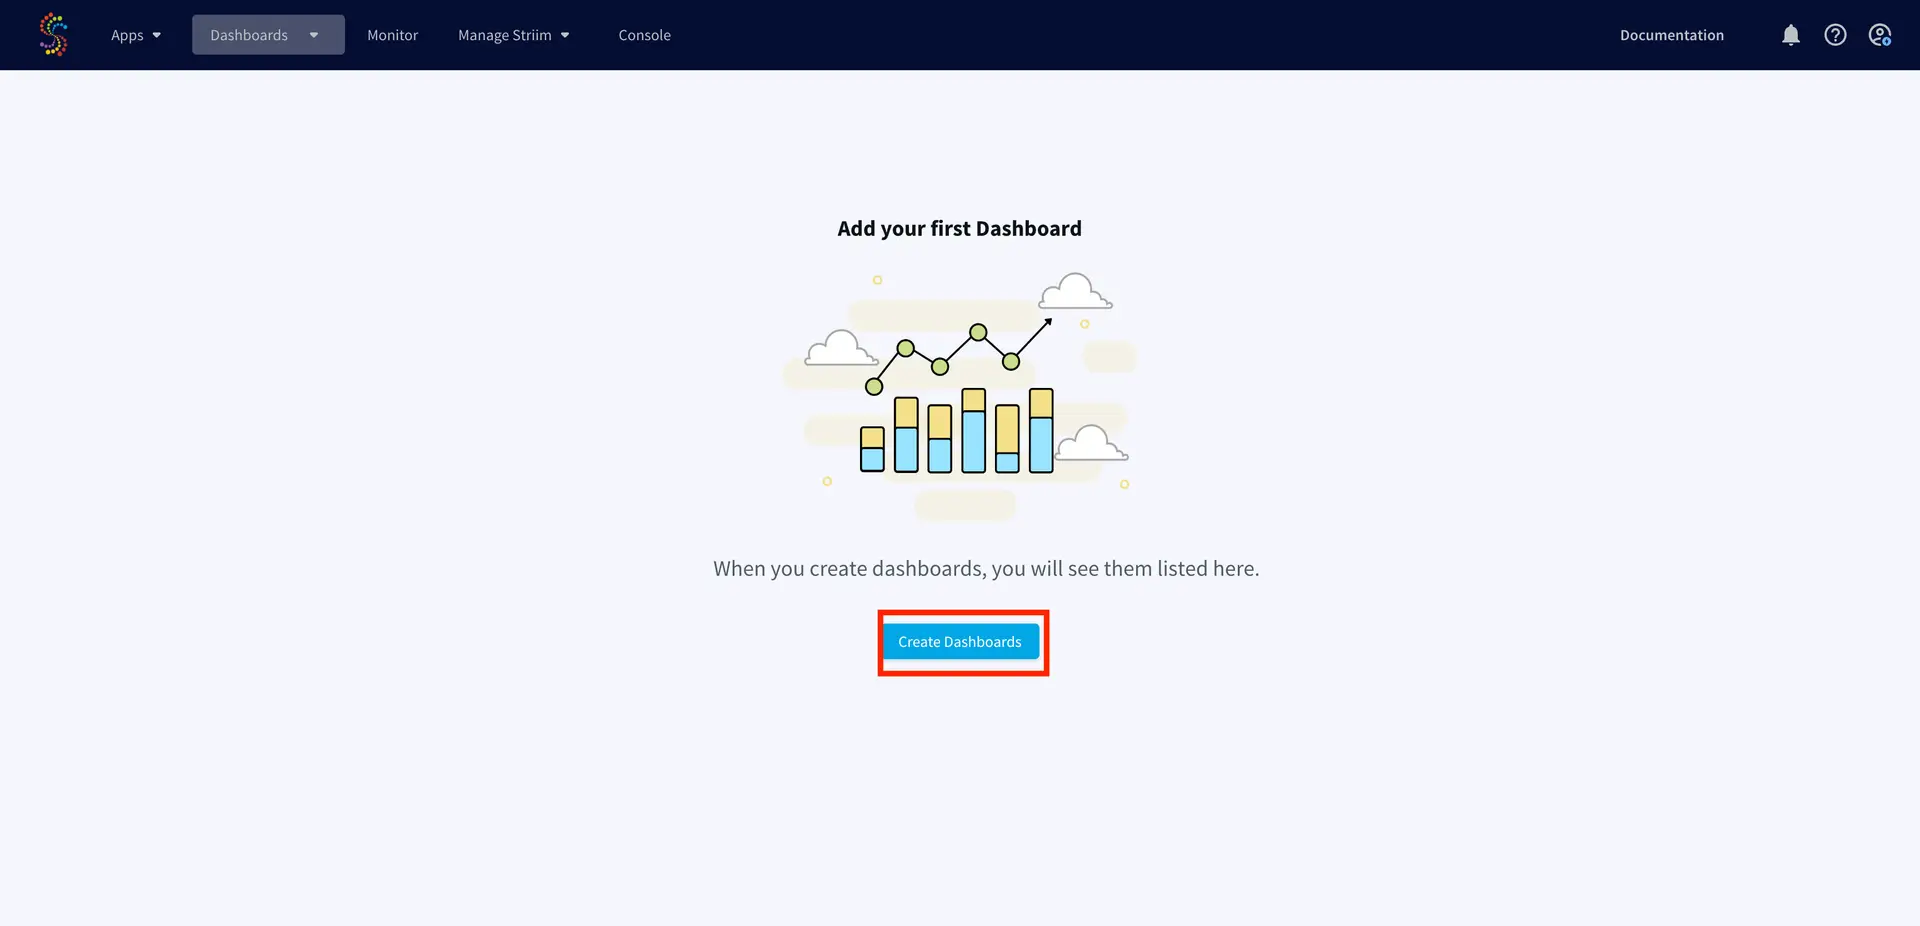
Explore Striim Dashboards
Use Striim’s SQL dashboard for real-time analytics
Free Streaming with Striim Developer
Stream up to 10 million events per month for free with Striim Developer
On this page
Overview
In today’s fast-paced, always-on lifestyle, real-time data is crucial. No one wants to know where their rideshare was ten minutes ago, miss out on the trade of a lifetime, or find out that half the items they ordered from their delivery app were out of stock. However, for many organizations, real-time data is out of reach due to the complexity of the infrastructure and the need to integrate with internal systems. This is where Striim comes in.
Why Striim?
Striim provides a simple unified data integration and streaming platform that combines change data capture (CDC), application integration, and Streaming SQL as a fully managed service.
Free Streaming for Developers!
With Striim Developer, you can prototype streaming use cases for production use with no upfront cost, stream up to 10 million events per month with unlimited Streaming SQL queries, and simulate real-time data behavior using Striim’s synthetic continuous data generator.
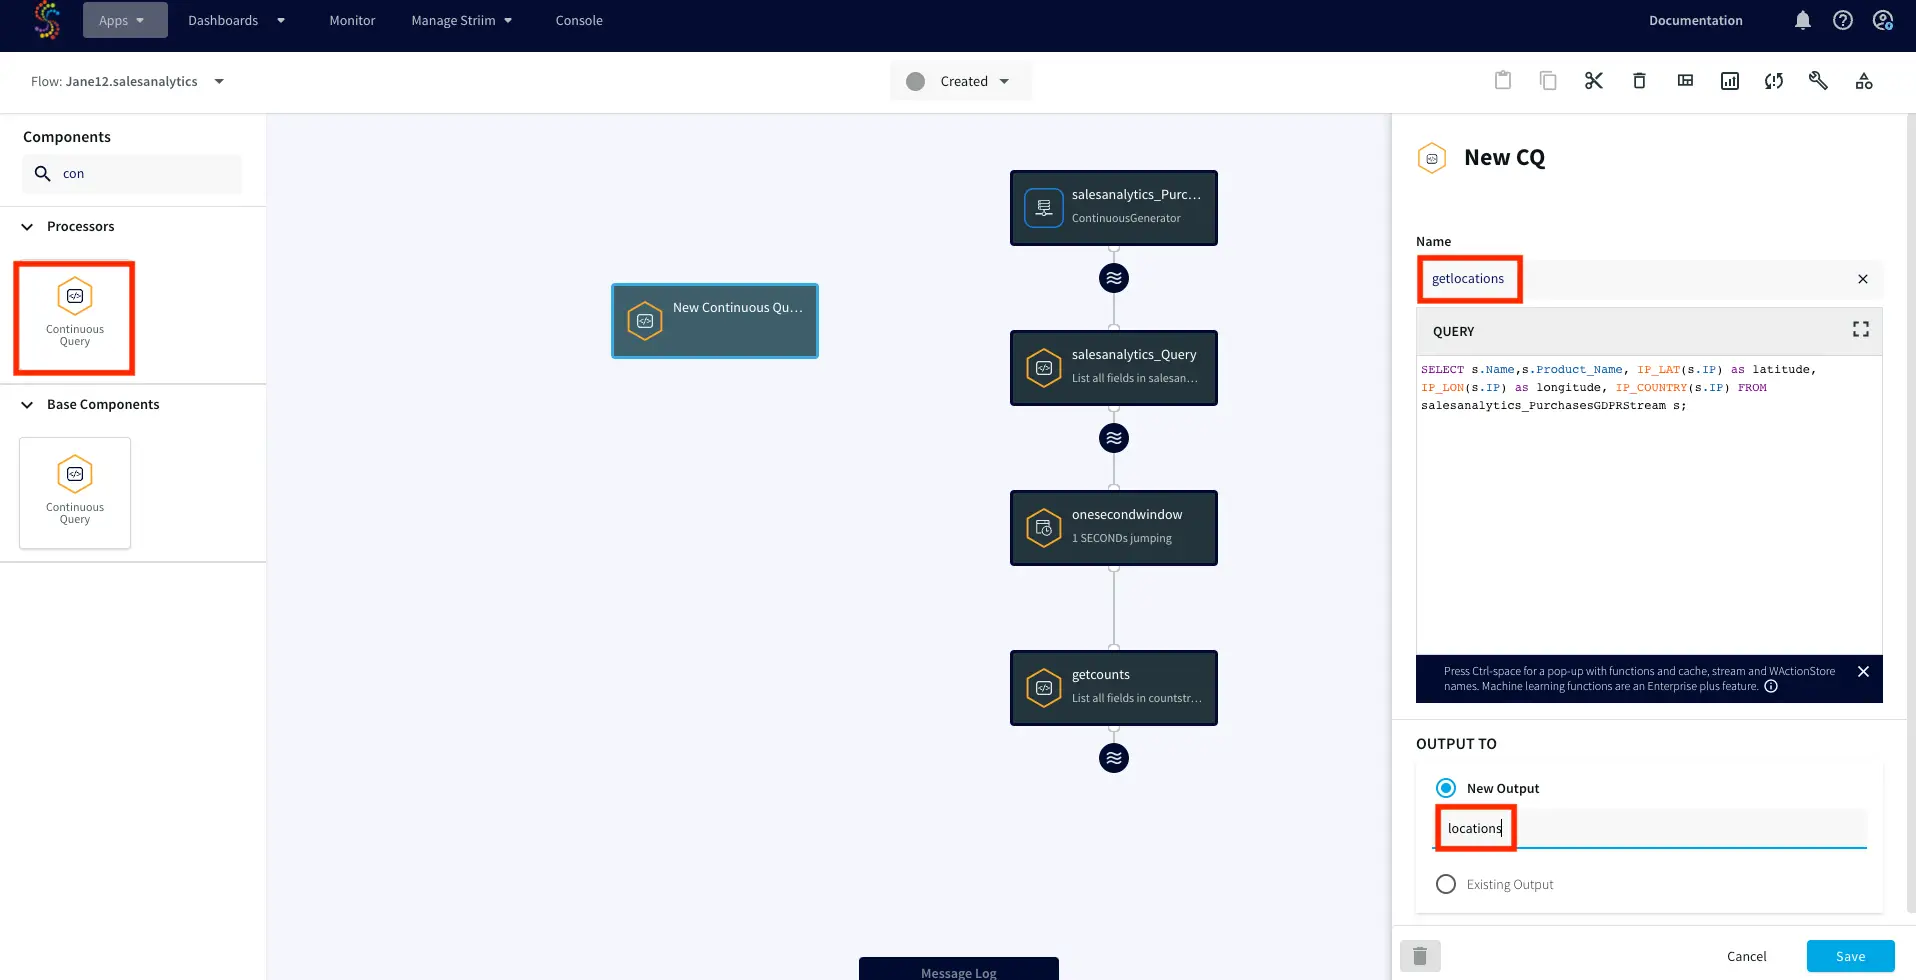
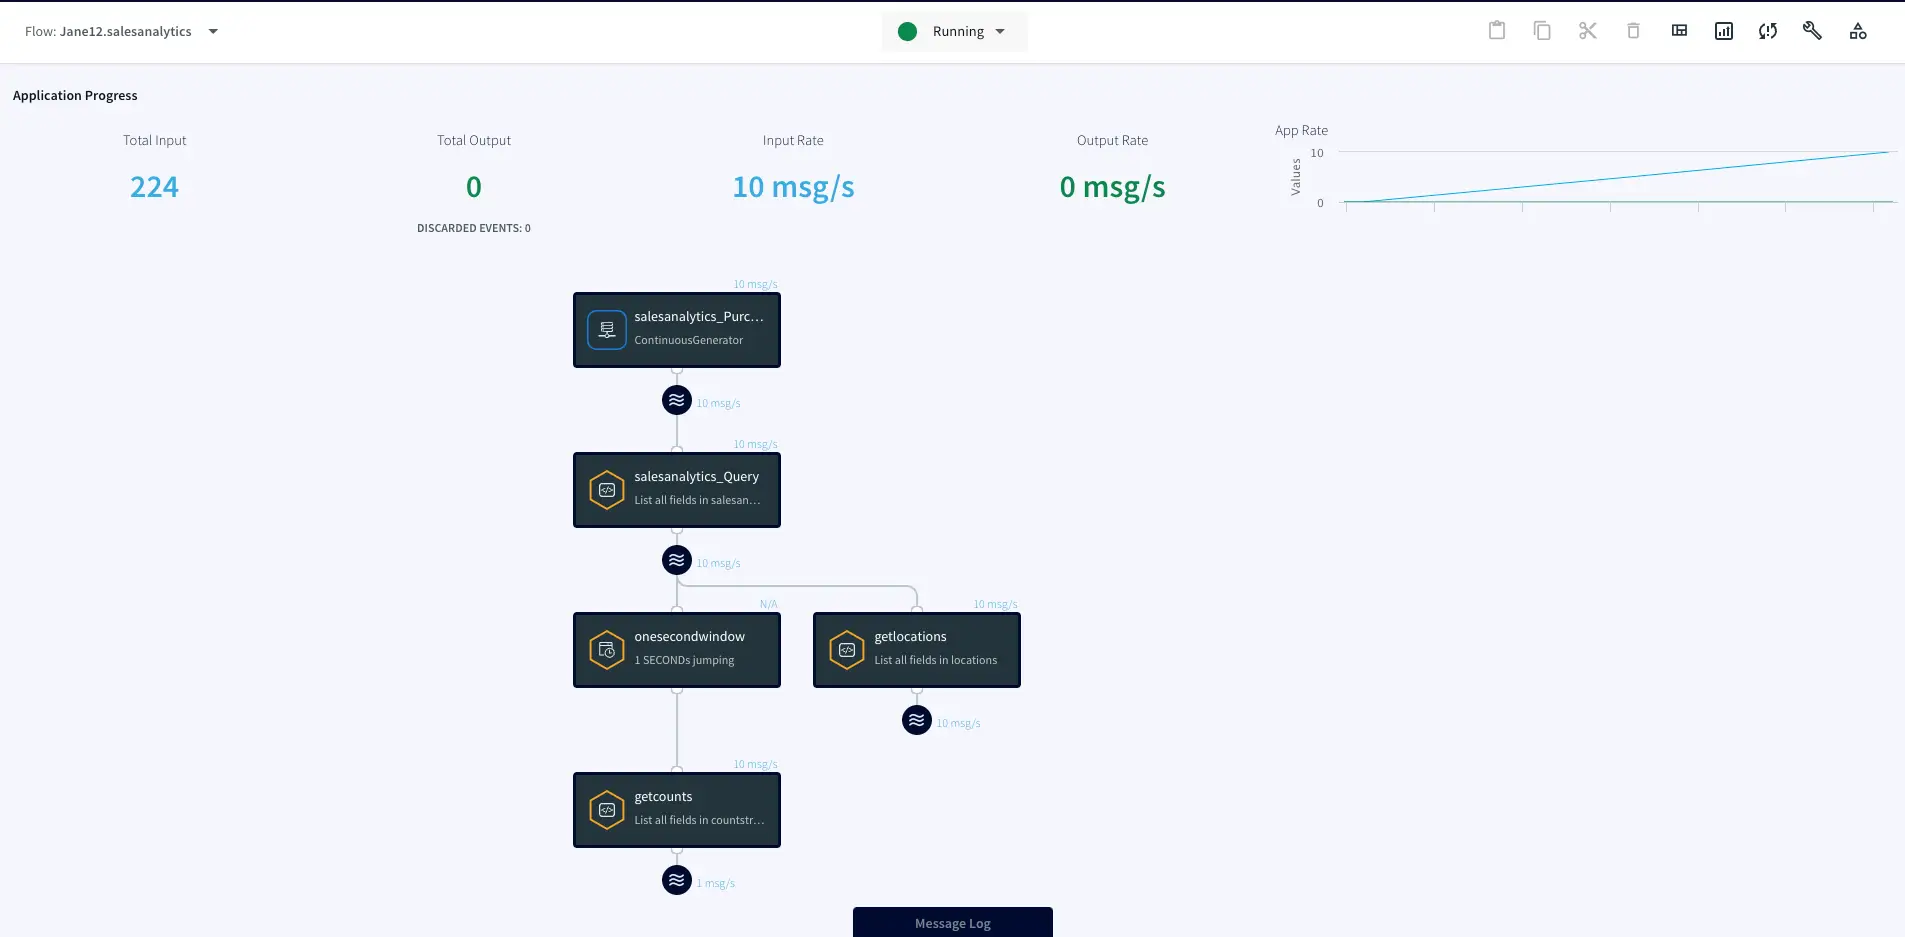
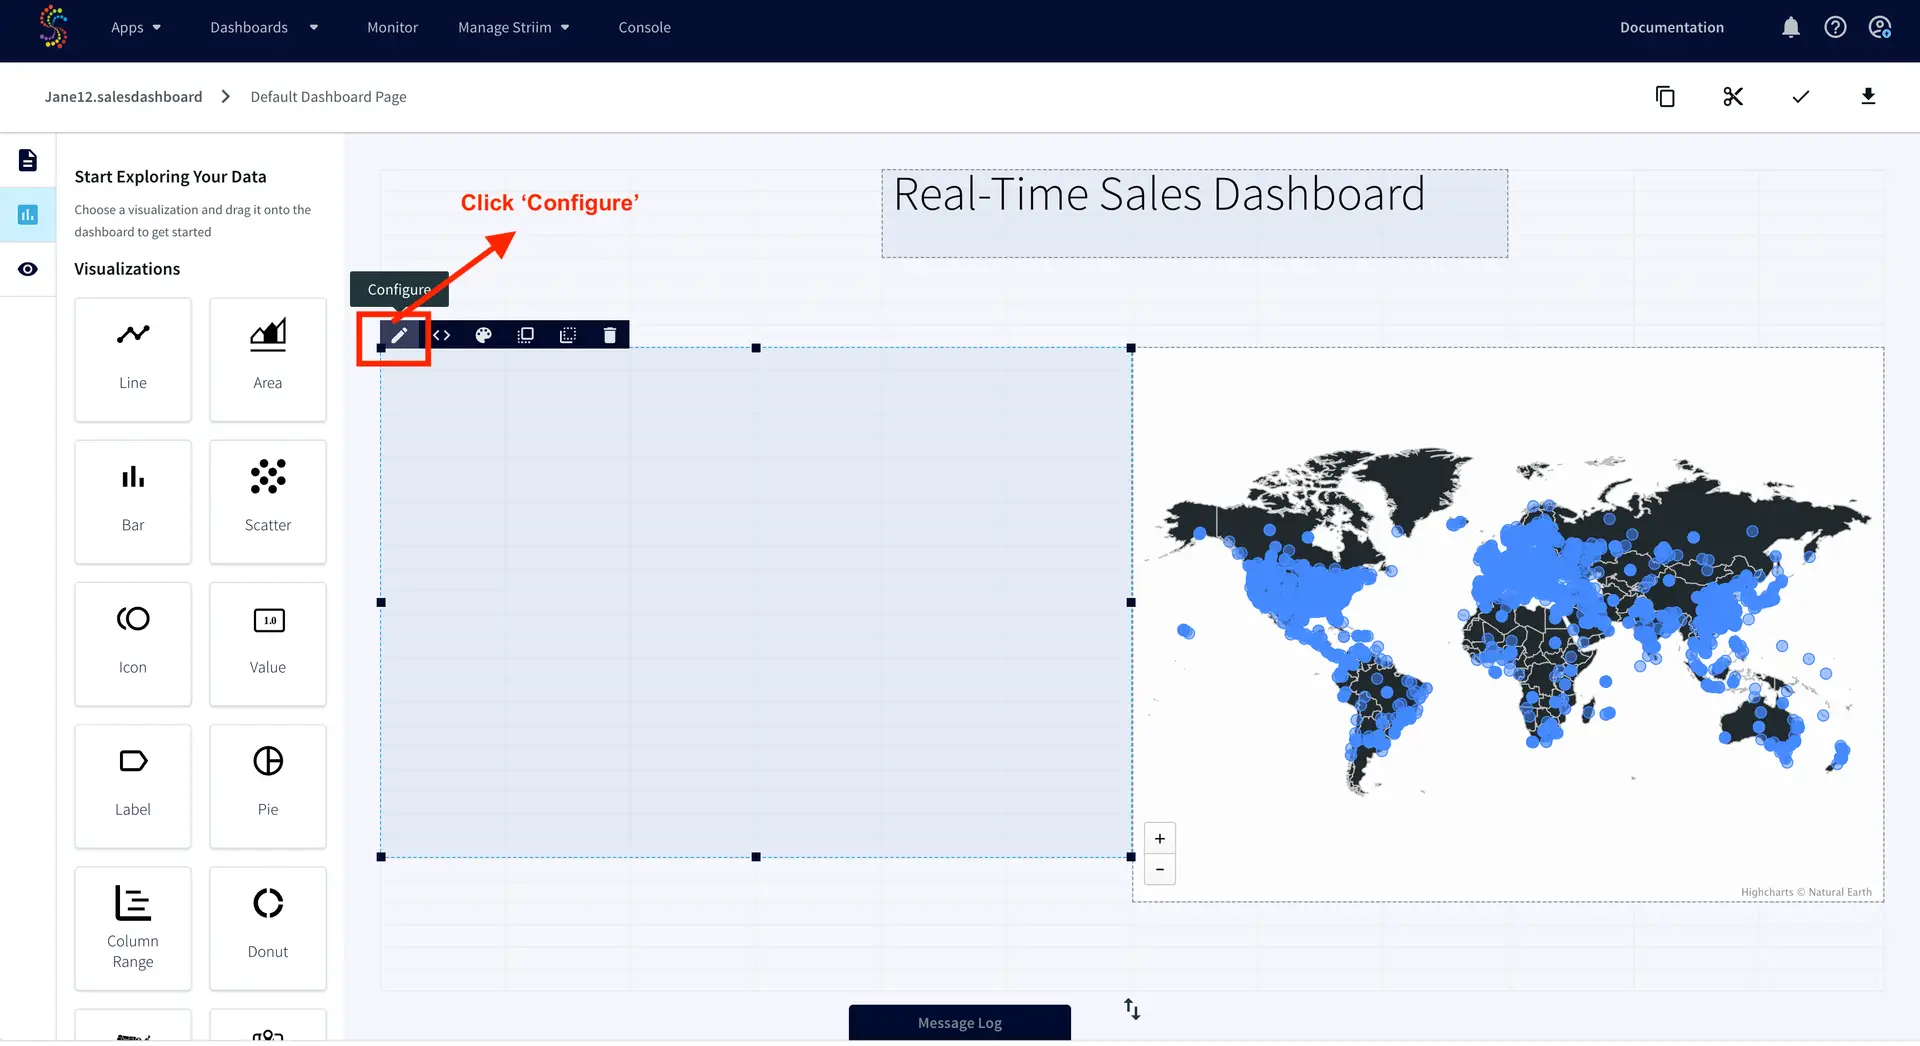
Want to see how easy it is to use Striim Developer for a real-time analytics use case? This tutorial will show you how to use Striim to process and analyze real-time data streams using continuous queries. You’ll also learn how to use a Striim dashboard for real-time data visualizations and reports. Whether you’re a data engineer or an analyst, this tutorial is the perfect introduction to real-time data insights with Striim Developer.
Core Striim Components
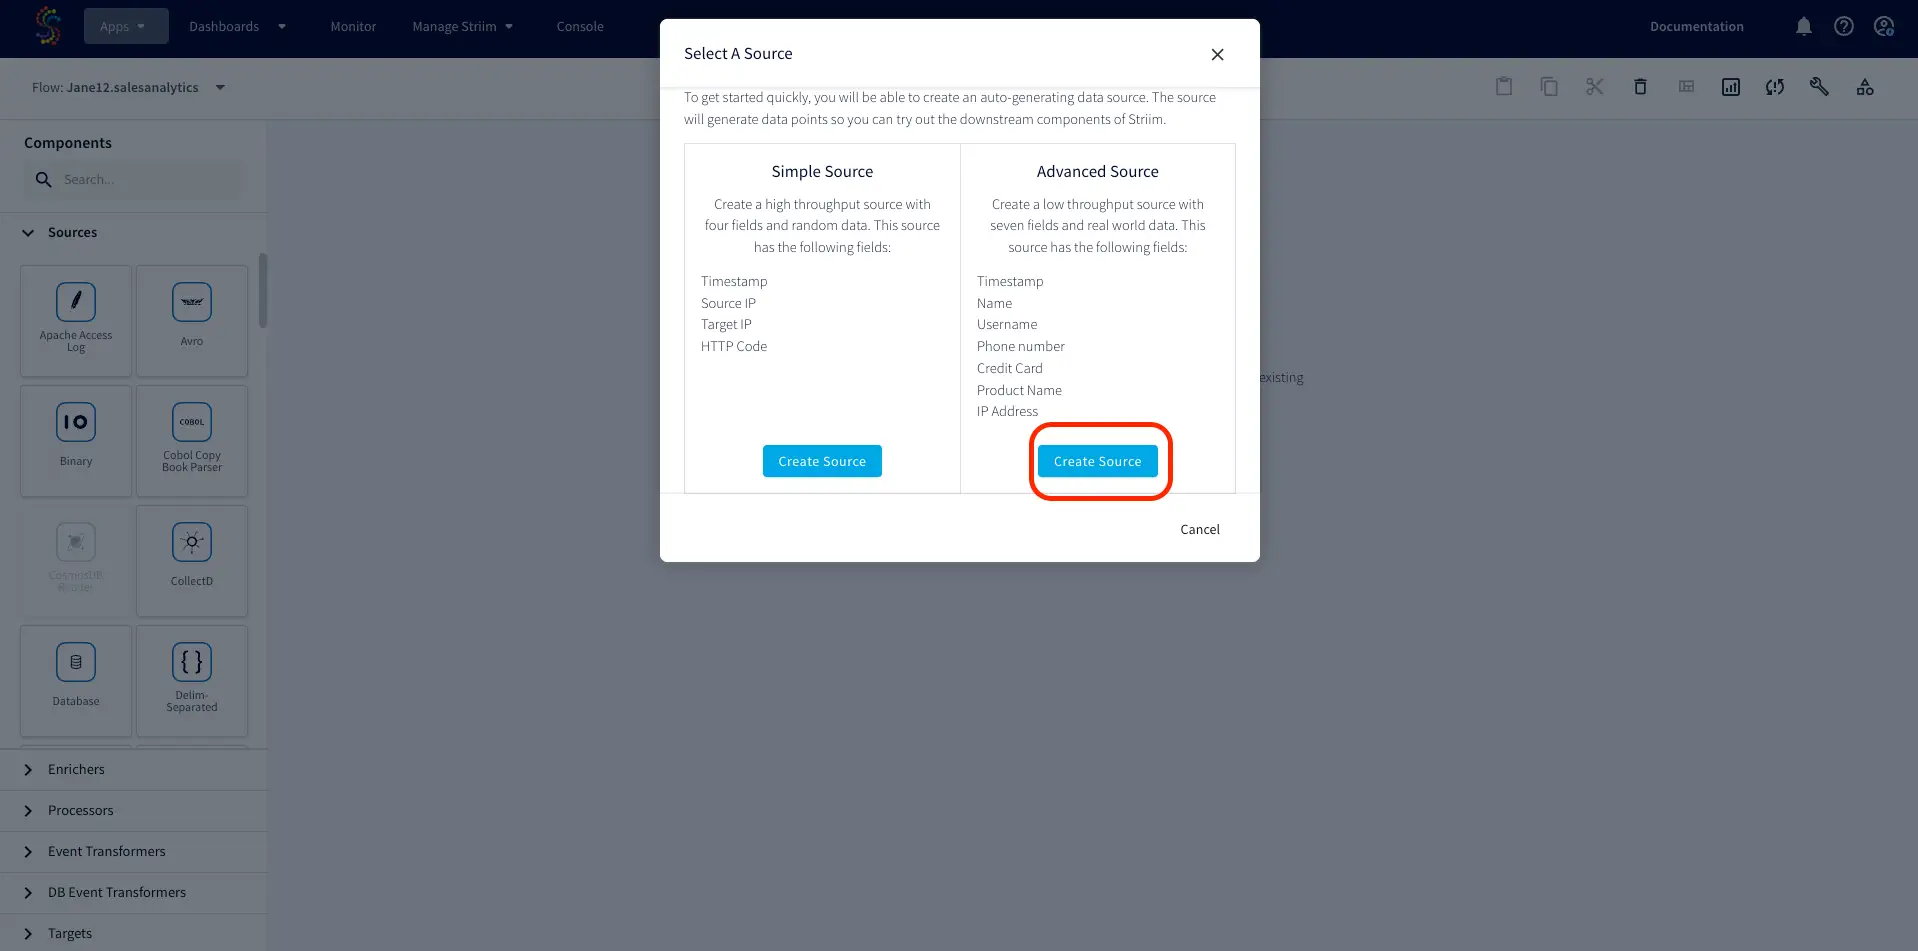
Continuous Generator: A continuous data-generator that can auto generate meaningful data for a given set of fields
Continuous Query: Striim’s continuous queries are continually running SQL queries that act on real-time data and may be used to filter, aggregate, join, enrich, and transform events.
Window: A window bounds real-time data by time, event count or both. A window is required for an application to aggregate or perform calculations on data, populate the dashboard, or send alerts when conditions deviate from normal parameters.
Dashboard: A Striim dashboard gives you a visual representation of data read and written by a Striim application.
Get Started
Watch this step-by-step video walkthrough or read through all the steps below:
Step 1: Sign up
To sign up for free Striim Developer, you can use either your personal or work email address. Go to https://signup-developer.striim.com/ and use your referral code. If you cannot reach this page, try disabling any ad/cookie blockers or sign up from an incognito page. Fill in all your details and select your choice of source and target from the dropdown list.
Step 2: Create your account and complete signup
After you submit the form in Step 1, check your inbox. You would receive an email from Striim Developer with the next steps. Check your spam folder if you do not get the following email.
Complete your signup by clicking ‘Complete’. That will prompt you to confirm your email address and set your username and password. You can ignore the part about whitelisting the IP address.
Step 3: Sign in using your username and password
Once you submit the form from Step 2, you will be redirected to developer.striim.com sign in page where you can enter your username and password. You will also receive a confirmation email that contains the reset password in case you forget your password.
Create your first real-time analytics app
Step 1: Create and name your Striim App
After you have signed into your developer account, click on ‘Create an App’ on the landing page.
Build your app using flow designer by selecting ‘Start from scratch’.
Next, name your app ‘salesanalytics’ and click ‘save’ on the lower right. Select the namespace that’s automatically set.
Step 2: Build a streaming application
Now you are ready to build your first real-time analytics application on Striim. To add an auto-generating data source, click on the relevant link on your screen as shown below:
You will have an option to choose between ‘Simple Source’ and ‘Advanced Source’. For this use-case, let us create an advanced source with seven fields. This will start generating streaming sample data.
The advanced source comes with a continuous query that processes and analyzes the data stream.
Now a Window component will be added that bounds the streaming data into buckets. Click the ‘+’ button as shown below and select ‘Window’.
We will set the size of the window to ‘1-second’ on the timestamp of the sample data events. Important: name it ‘onesecondwindow’ for this exercise.
Now scroll down on the window editor and populate the following fields:
Time: 1 Second
on
EventTime
So it looks exactly like this:
Next we will create a query to analyze this data. A CQ (Continuous Query) will process streaming data in real-time. You can name it ‘getcounts’ or whatever you want (no spaces or special characters). To add a CQ, select ‘+’ and connect next CQ component.
Copy and paste the following Streaming SQL snippet into the ‘CQ’ box:
SELECT count(*) as transactioncount, DNOW() as time FROM
onesecondwindow o;
IMPORTANT: name the New Output ‘countstream’.
As you may have noticed, the sample data has an IP address (every computer’s network ID) for each transaction. However, the business wants to know where their customers are coming from and we are missing that data. Luckily, Striim has a way of pulling locations for IP addresses.
Click and drag another ‘Continuous Query’ from the left-side panel on to the flow designer panel (anywhere on the blank/white space)
You can name the component ‘getlocations’ or whatever you want (no special characters or whitespaces)
Now copy and paste the following snippet in to the query box:
SELECT s.Name,s.Product_Name, IP_LAT(s.IP) as latitude, IP_LON(s.IP) as longitude, IP_COUNTRY(s.IP) FROM salesanalytics_PurchasesGDPRStream s;
IMPORTANT: name the New Output ‘locations’
Step 3: Deploy and Run your Striim Application
After you have saved all the components of your streaming app, you may deploy and run the Striim application. Click on the dropdown list next to ‘Created’ and choose ‘Deploy App’.
You can select any available deployment group and click ‘Deploy’.
After your Striim app is deployed, you can run the streaming application by clicking ‘Start App’.
You can monitor the processed data through the ‘eye’ wizard next to any stream component.
Explore Striim Dashboards
A Striim dashboard gives you a visual representation of data read and written by a Striim application. We will create a dashboard for the above data stream to visualize streaming data in real-time. Start by downloading this file.
Click on ‘View All Dashboards’ from the dropdown next to ‘Dashboards’ at the top of screen.
Click on ‘Create Dashboard’ and import the above downloaded file and select ‘Import all queries into this namespace’ using the auto selected namespace.
Here you will see a Striim Dashboard with a map already created. You will create a real-time chart yourself!
We will now create a line chart with our sales data. Click the ‘Line’ chart on the left side, drag it into the panel. Then select ‘Edit Query’ on the ‘<>’ icon on the top left.
Name the query ‘getcounts’ or whatever you want (no whitespace or special characters) and push ‘Enter’ on your keyboard.
Enter the following query into the input
SELECT * FROM countstream;
Click the ‘configure’ button as shown below to add axes details into your line graph. Choose ‘transactioncount’ field for y axis and ‘time’ with datetime format for x axis. For real-time chart, the data retention time is ‘current’.
Now you have a real-time sales dashboard!
Wrapping Up: Start your Free Trial Today
In this recipe, we have walked you through steps for creating a Striim application using test data from Striim’s Continuous Generator adapter. You can query the data stream using continuous queries and partition it using a Window. We have also demonstrated how to create aStriim dashboard for real-time data visualization.You can try adding your own continuous queries to the sales app and build whatever charts you want!
As always, feel free to reach out to our integration experts to schedule a demo, or try Striim developer for free here.
Tools you need
Striim
Striim’s unified data integration and streaming platform connects clouds, data and applications.


 (Screenshot- 8 – ServiceNow account authenticated)