Tutorial
Emergency Room Analytics with Data Streaming
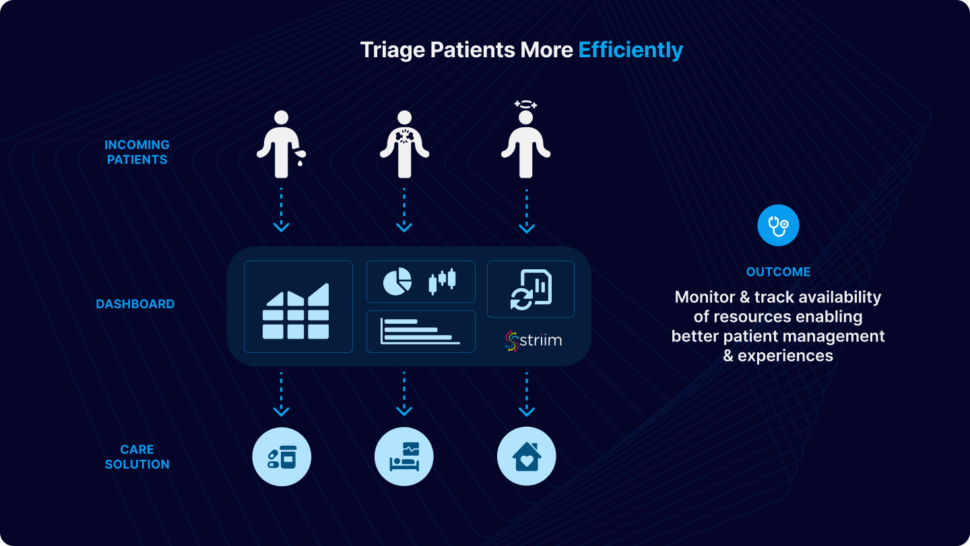
Improve efficiency, patient care, and resource allocation with real-time data
Benefits
Real-Time Monitoring
Process incoming ER data in real-time for immediate triage and resource allocation
Enhanced Decision-Making Make informed decisions through visual dashboards that represents key metrics and KPIs
Efficient Communication
Streaming analytics facilitate communication among healthcare teams as well as with patients for better collaboration
On this page
Healthcare Needs Real-Time Data
In the dynamic landscape of healthcare, the demand for real-time data in emergency room operations has become increasingly important. Hospital emergency rooms serve as critical hubs for patient care, responding to a myriad of medical crises with urgency and precision. The ability to monitor and analyze real-time data within these environments is critical for enhancing operational efficiency, optimizing resource allocation, and ultimately improving patient outcomes.
As healthcare professionals navigate the complexities of emergency room settings, a comprehensive understanding of real-time data through intuitive dashboards becomes indispensable.
This tutorial aims to show the significance of healthcare monitoring through a real-time data dashboard, providing insights into how these tools can revolutionize emergency room management, streamline workflows, and contribute to a more responsive and patient-centric healthcare system. Whether it’s tracking patient flow, resource utilization, or anticipating surges in demand, the integration of real-time data dashboards empowers healthcare providers to make informed decisions swiftly and proactively in the ever-evolving landscape of emergency care.
Why Striim for Healthcare?
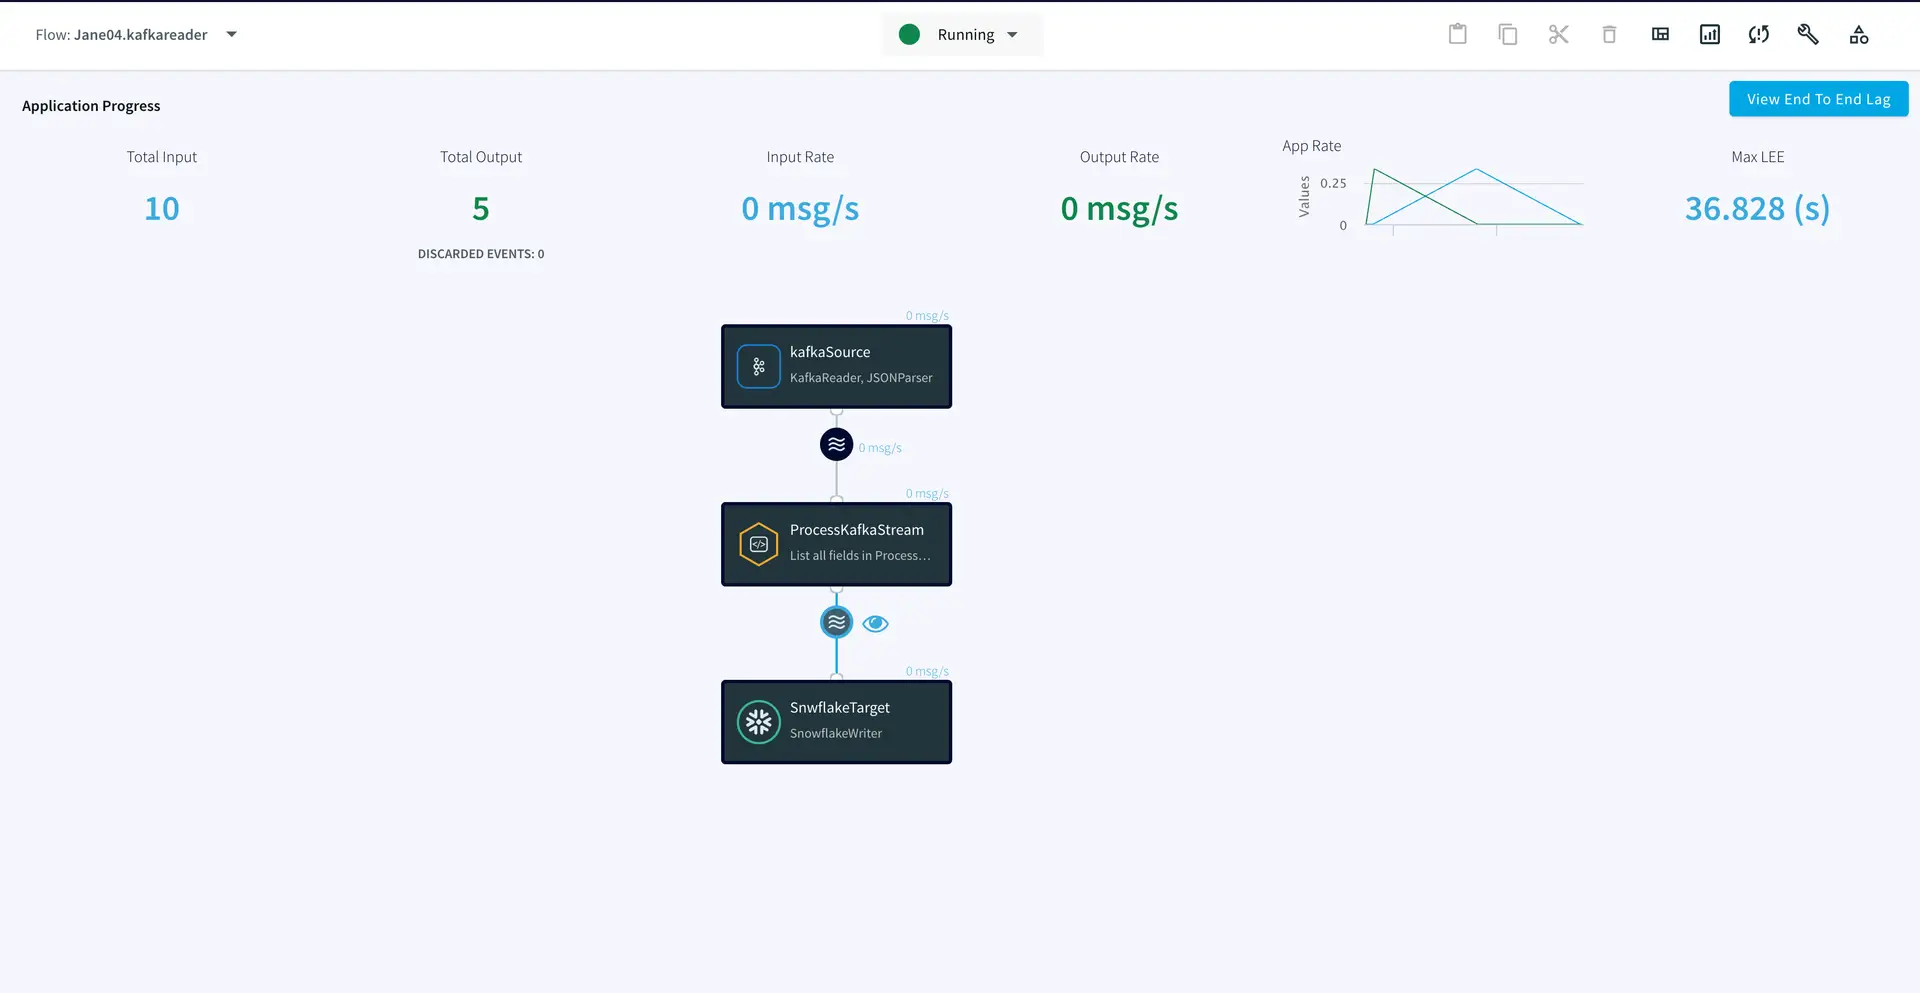
Striim offers a straightforward, unified data integration and streaming platform that combines change data capture (CDC), Streaming SQL and real-time analytical dashboards as a fully managed service.The Continuous Query (CQ) component of Striim uses SQL-like operations to query streaming data with almost no latency.
Using streaming analytics and real-time dashboards for Emergency Room (ER) monitoring processes incoming patient data in real-time, allowing for immediate triage and prioritization of patients based on the severity of their conditions. Hospitals can monitor the availability of resources such as beds, medical staff, and equipment in real-time. This allows for efficient allocation and utilization of resources. Dashboards provide a visual representation of key metrics and KPIs. Healthcare professionals can make informed decisions quickly by accessing real-time data on patient statuses, resource utilization, and overall ER operations.
Use-Case
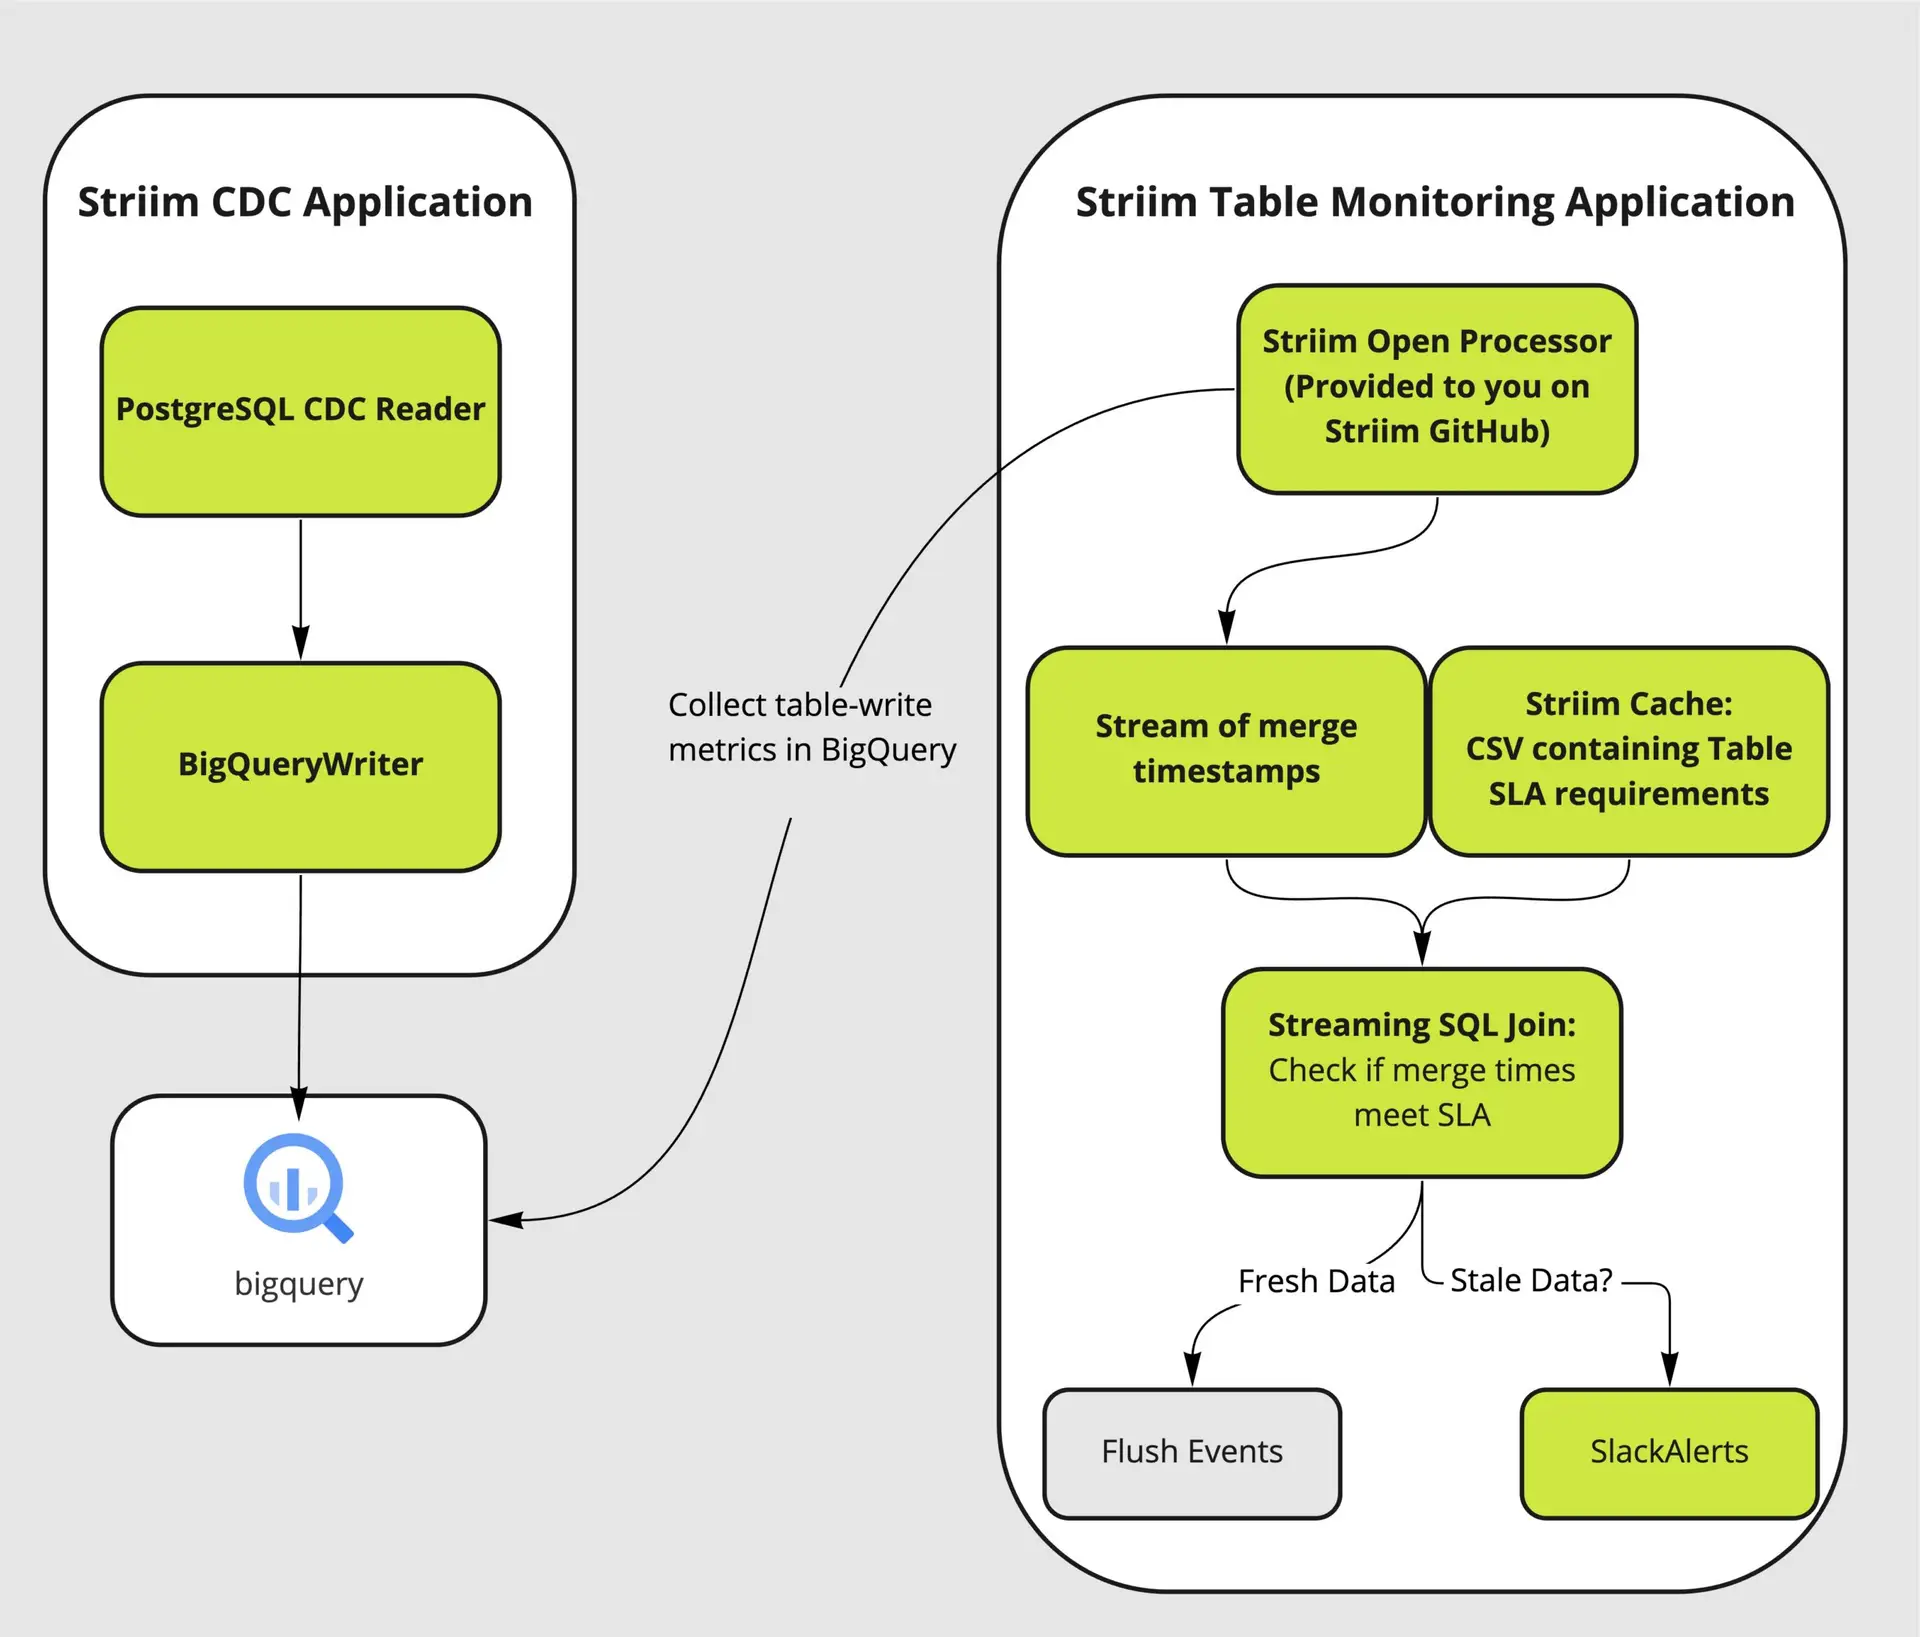
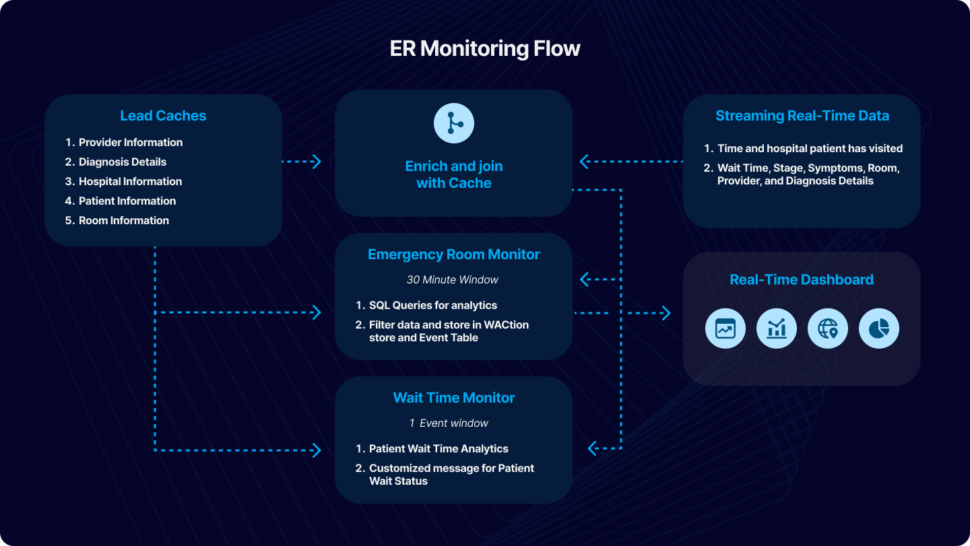
In this particular use case, patient’s data from their ER visit is continuously streamed in real-time, undergoing dynamic filtering and processing. Cache files, containing essential details such as hospital information, provider details, and patient data, are employed to enhance and integrate the data stream. The resulting processed data is utilized for immediate analytics through the use of dashboards and elastic storage.
For the purpose of this tutorial, we have simulated fictional data in CSV format to emulate a real-world scenario. The data can be streamed from diverse sources and databases supported by Striim. This application tutorial is built from four primary sections: Loading Cache, Reading and Enriching Real-Time Data Stream, Emergency Room (ER) Monitoring, and Wait Time Monitoring.
The incoming data includes fields such as Timestamp, hospital ID, wait time, stage, symptoms, room ID, provider ID, and diagnosis details. The initial step involves enriching the data using cache, which includes adding details like hospital name, geographical location, patient name, patient age, and patient location. The enriched data is subsequently merged with other cache files, encompassing room details, provider details, and diagnosis. An outer join is executed to accommodate potential null values in these columns.
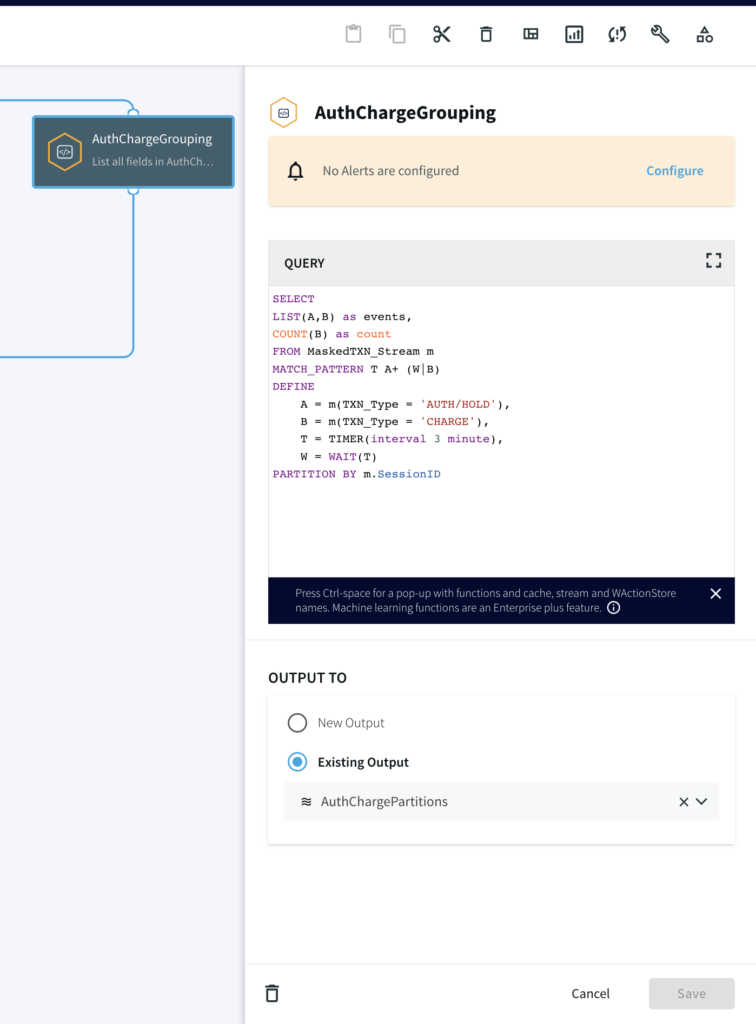
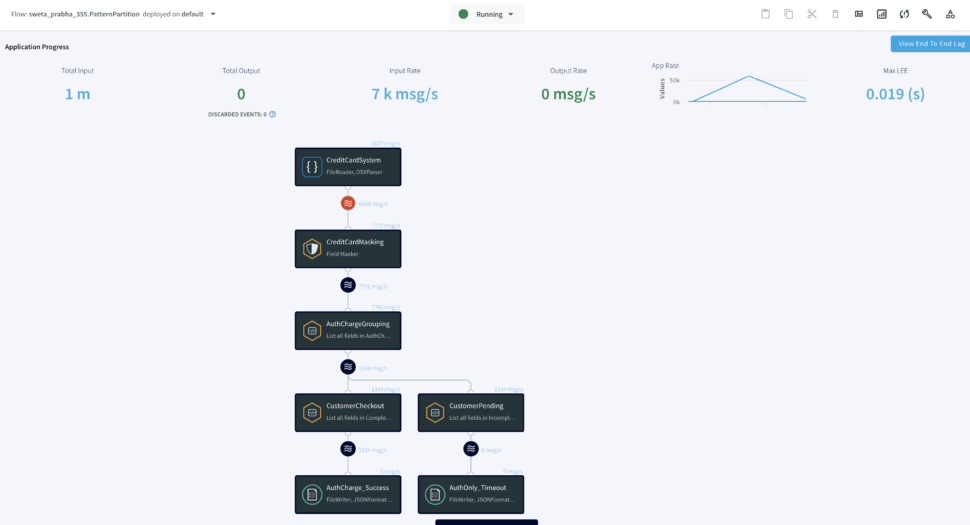
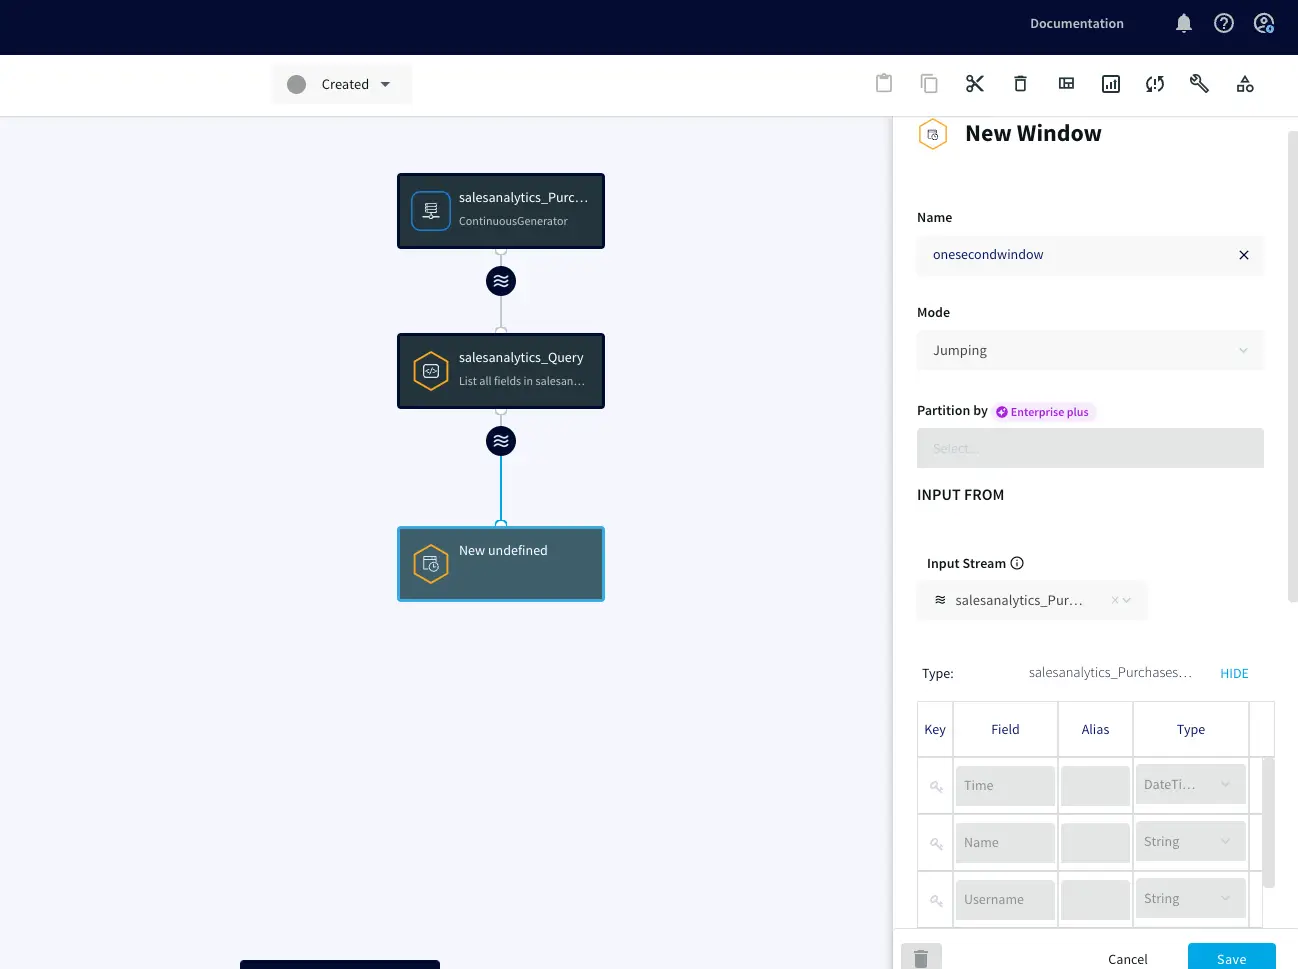
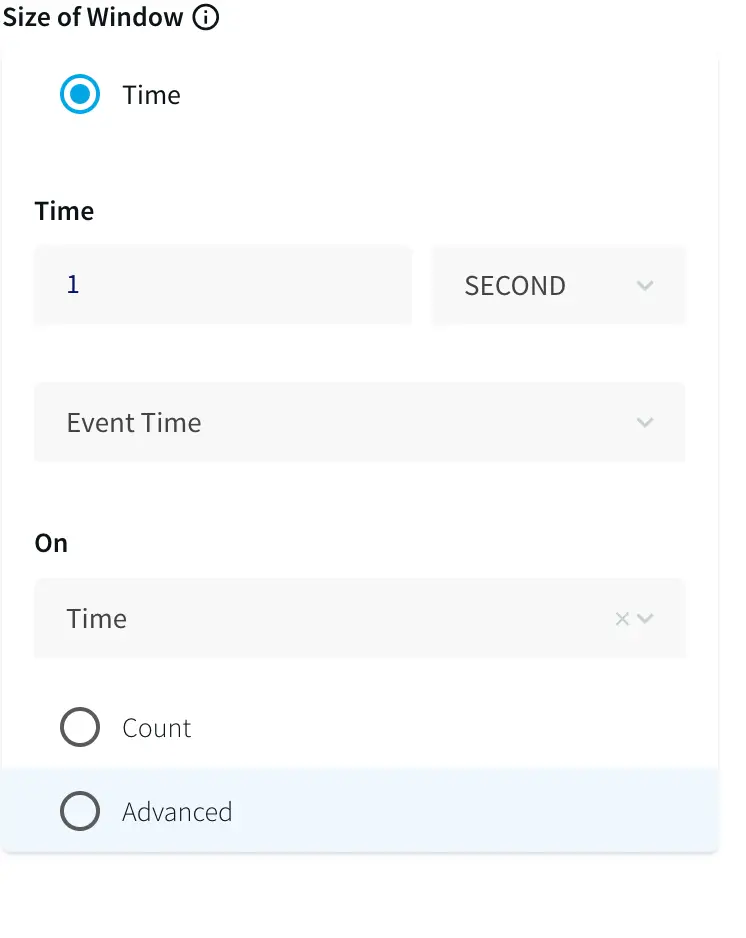
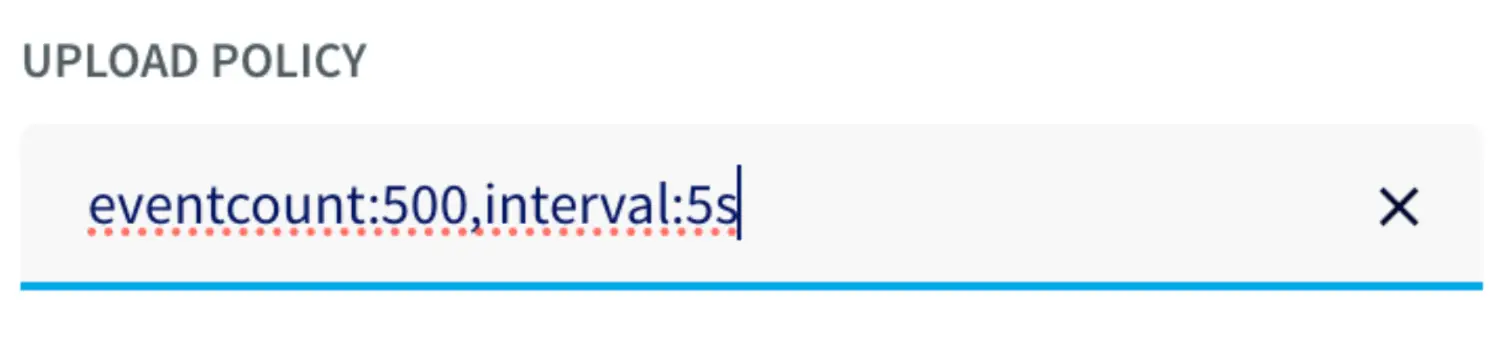
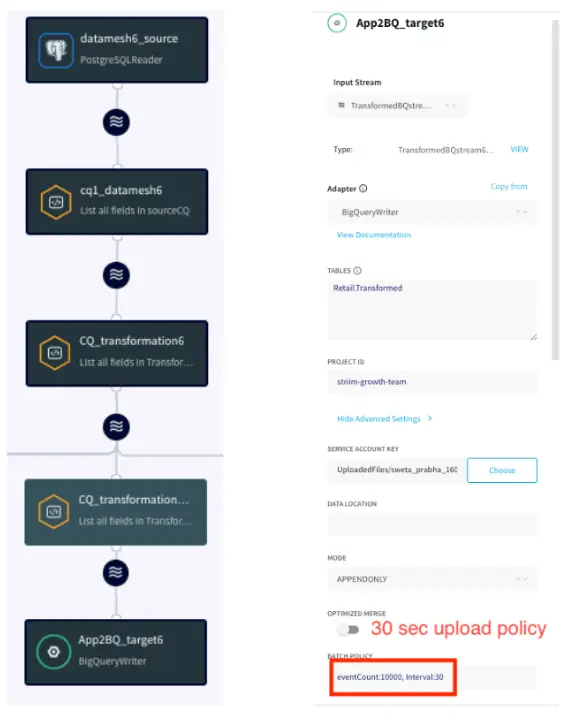
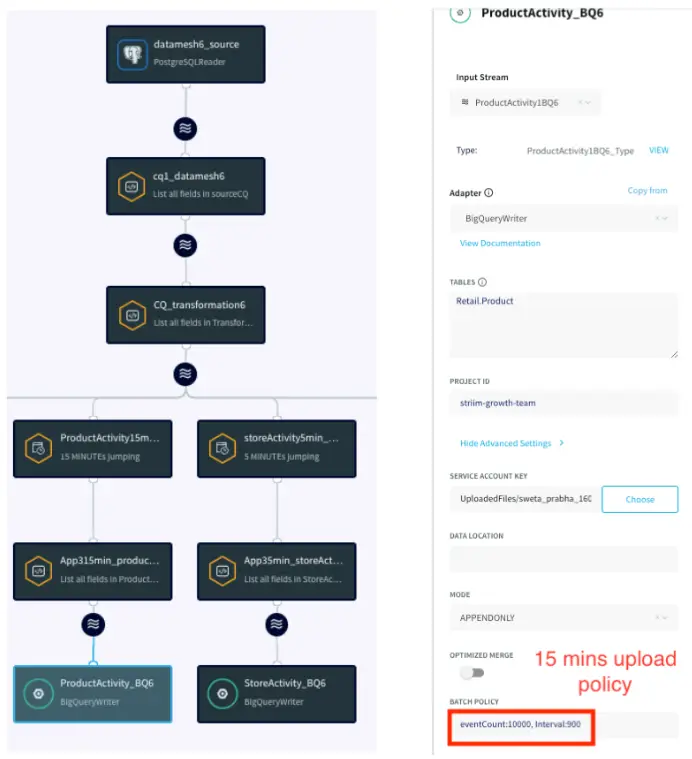
Once the data is enhanced by incorporating information from the cache, ER Monitoring takes place within a 30-minute window. A window component in Striim bounds real-time data based on time (e.g., five minutes), event count (e.g., 10,000 events), or a combination of both. Complex SQL-like queries, known as Continuous Queries (CQ), transform the data for various analytics and reporting objectives. Processed data from each stream is stored in an Event Table for real-time access and a WAction store for historical records. Event tables are queried to construct a Striim dashboard for reporting purposes. We will take a detailed look at the various components of the Striim application in this tutorial.
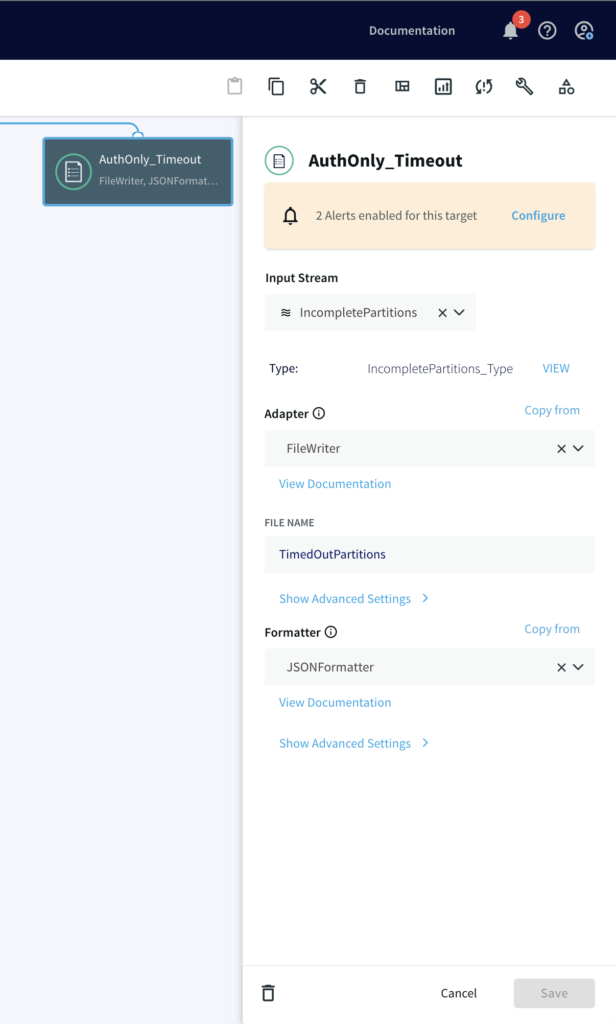
Wait Time Monitoring is implemented to generate personalized messages for patients, notifying them about the estimated wait time. In a real-world scenario, these messages could be disseminated through text or email alerts.
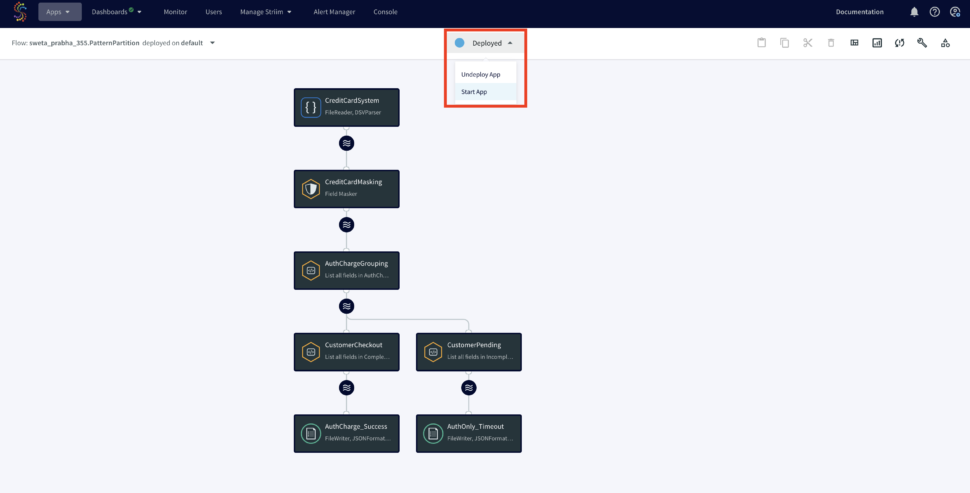
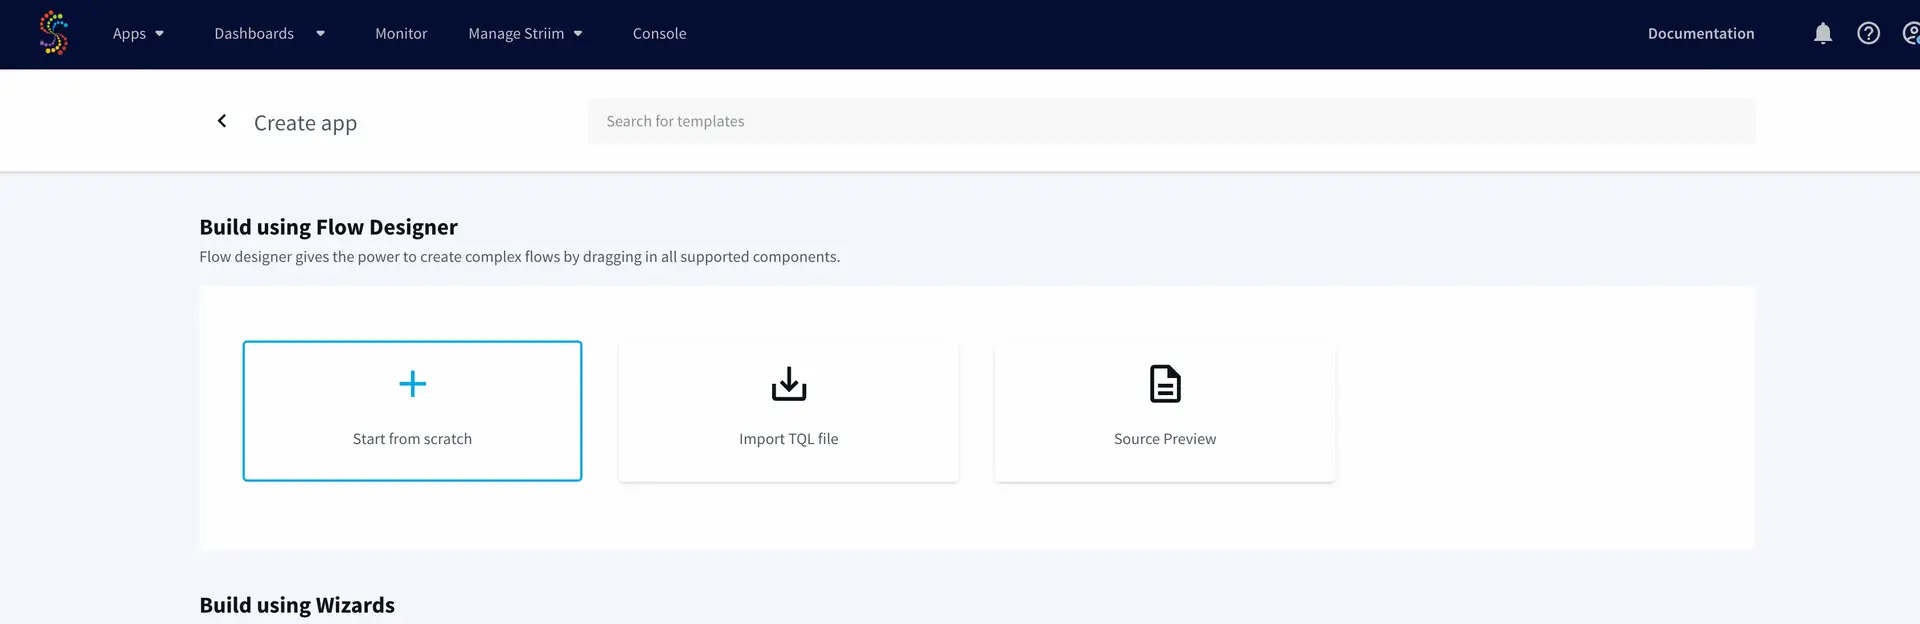
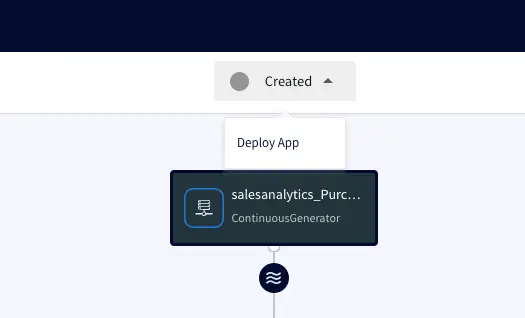
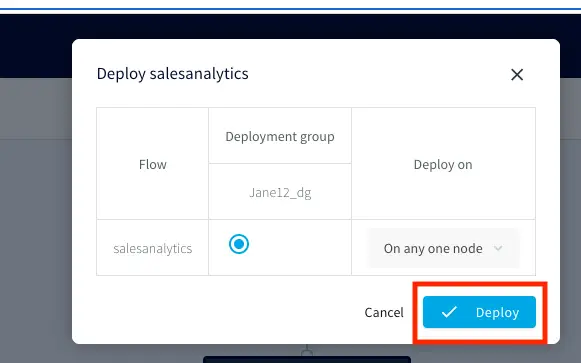
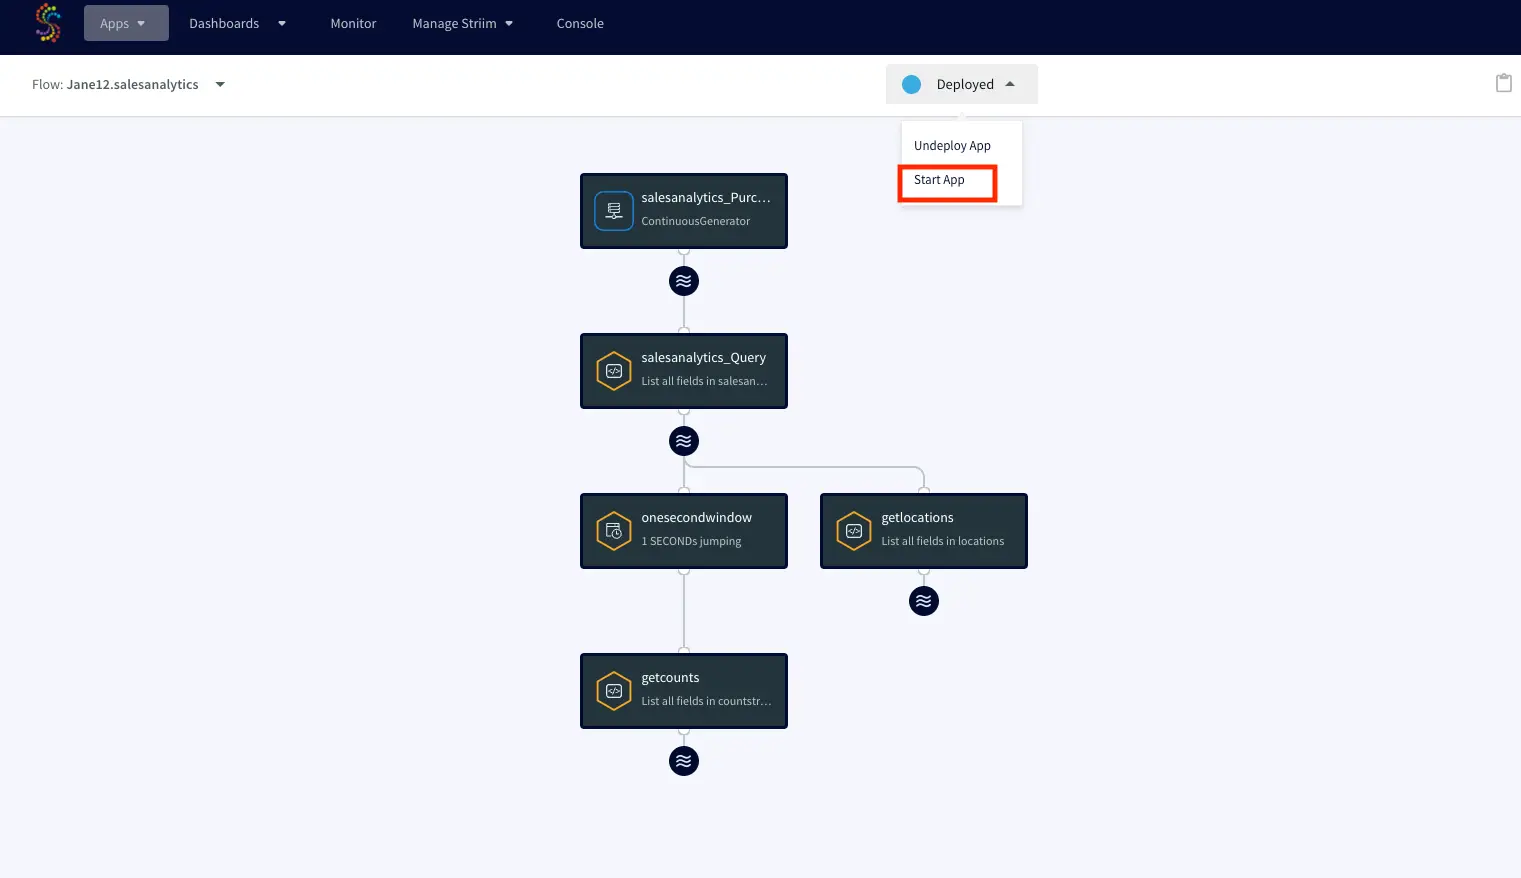
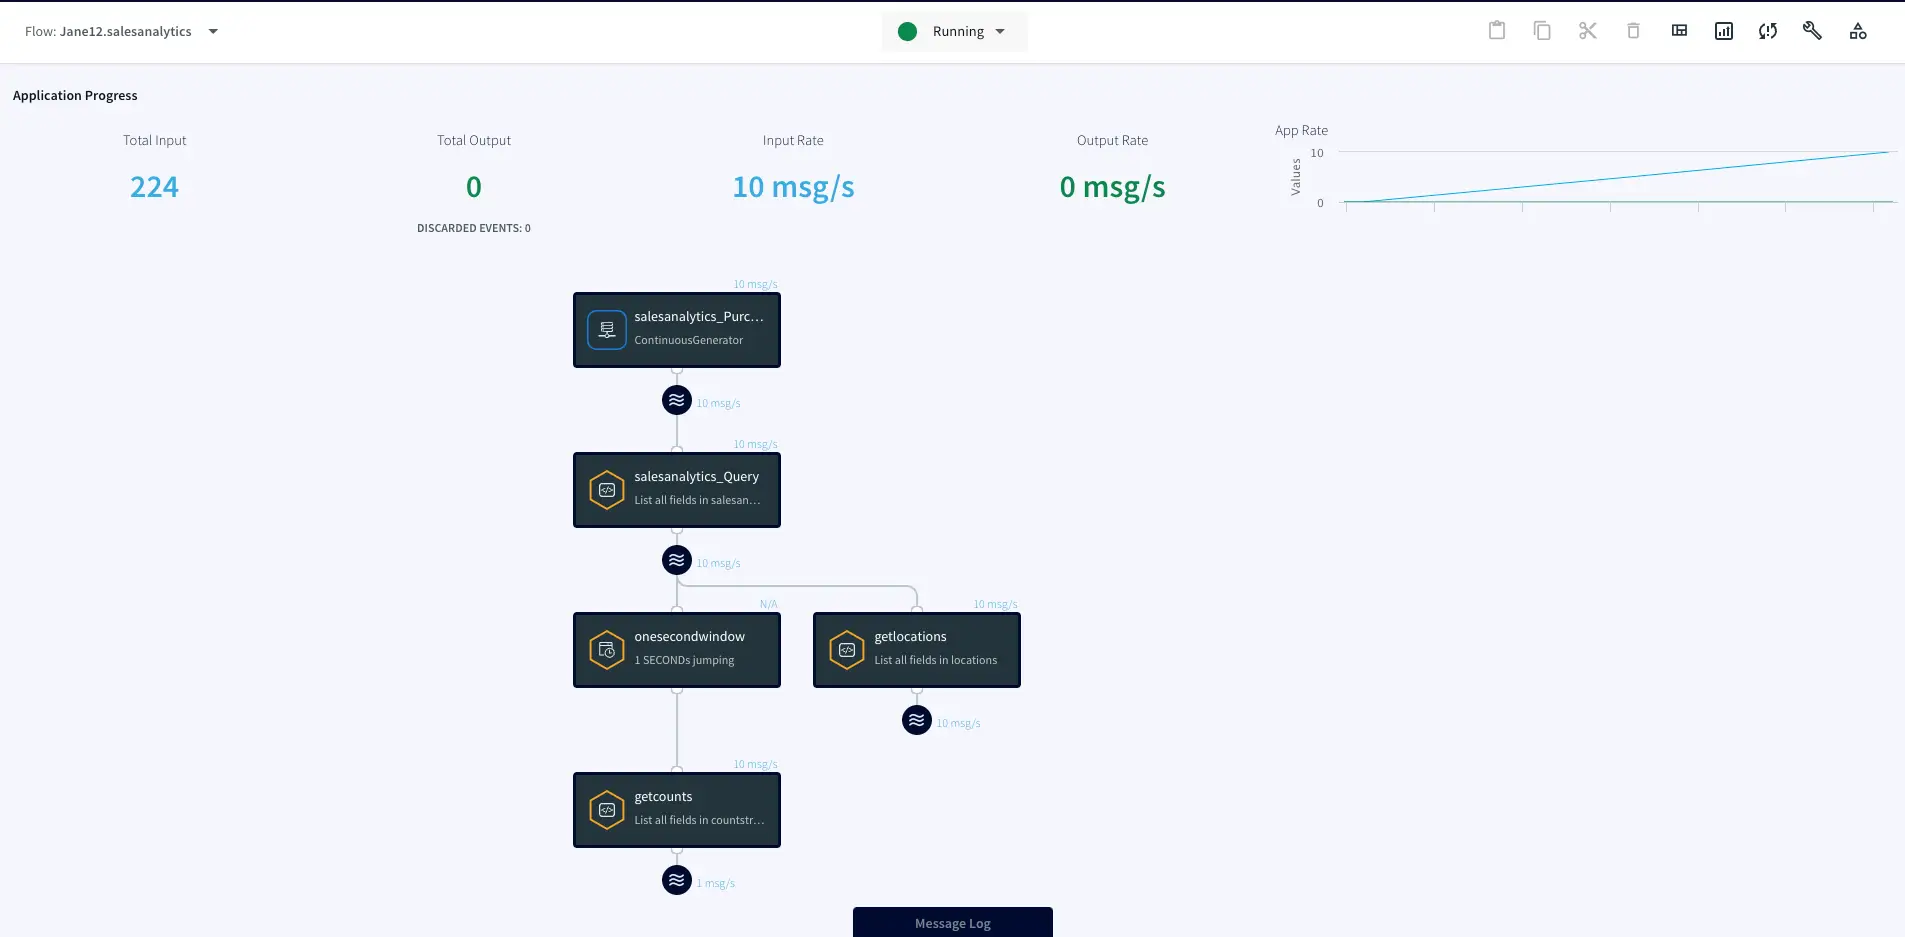
To give this app a try, please download the TQL file, dashboard and the associated CSV files from our github repository. You can directly upload and run the TQL file by making a few changes discussed in the later sections.
Core Striim Components
File Reader: Reads files from disk using a compatible parser.
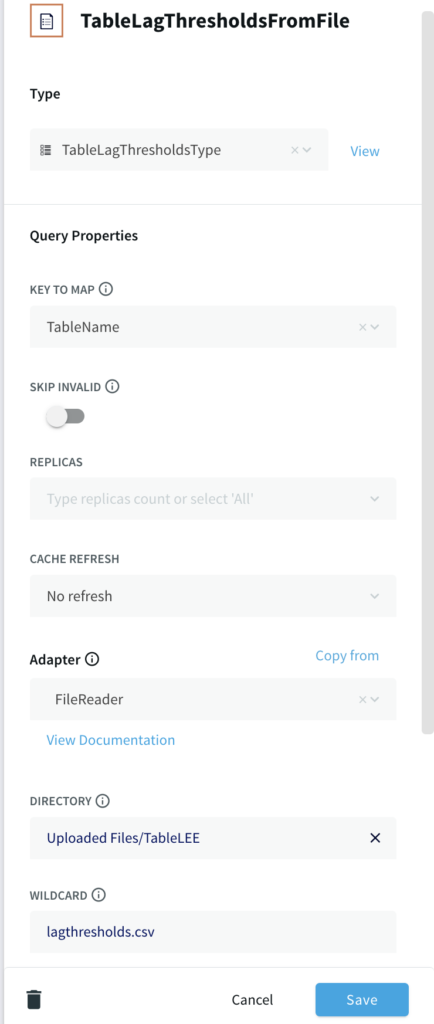
Cache: A memory-based cache of non-real-time historical or reference data acquired from an external source, such as a static file of postal codes and geographic data used to display data on dashboard maps, or a database table containing historical averages used to determine when to send alerts. If the source is updated regularly, the cache can be set to refresh the data at an appropriate interval.
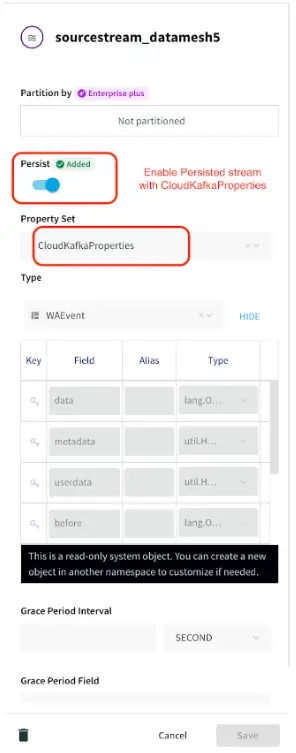
Stream: A stream passes one component’s output to one or more other components. For example, a simple flow that only writes to a file might have this sequence
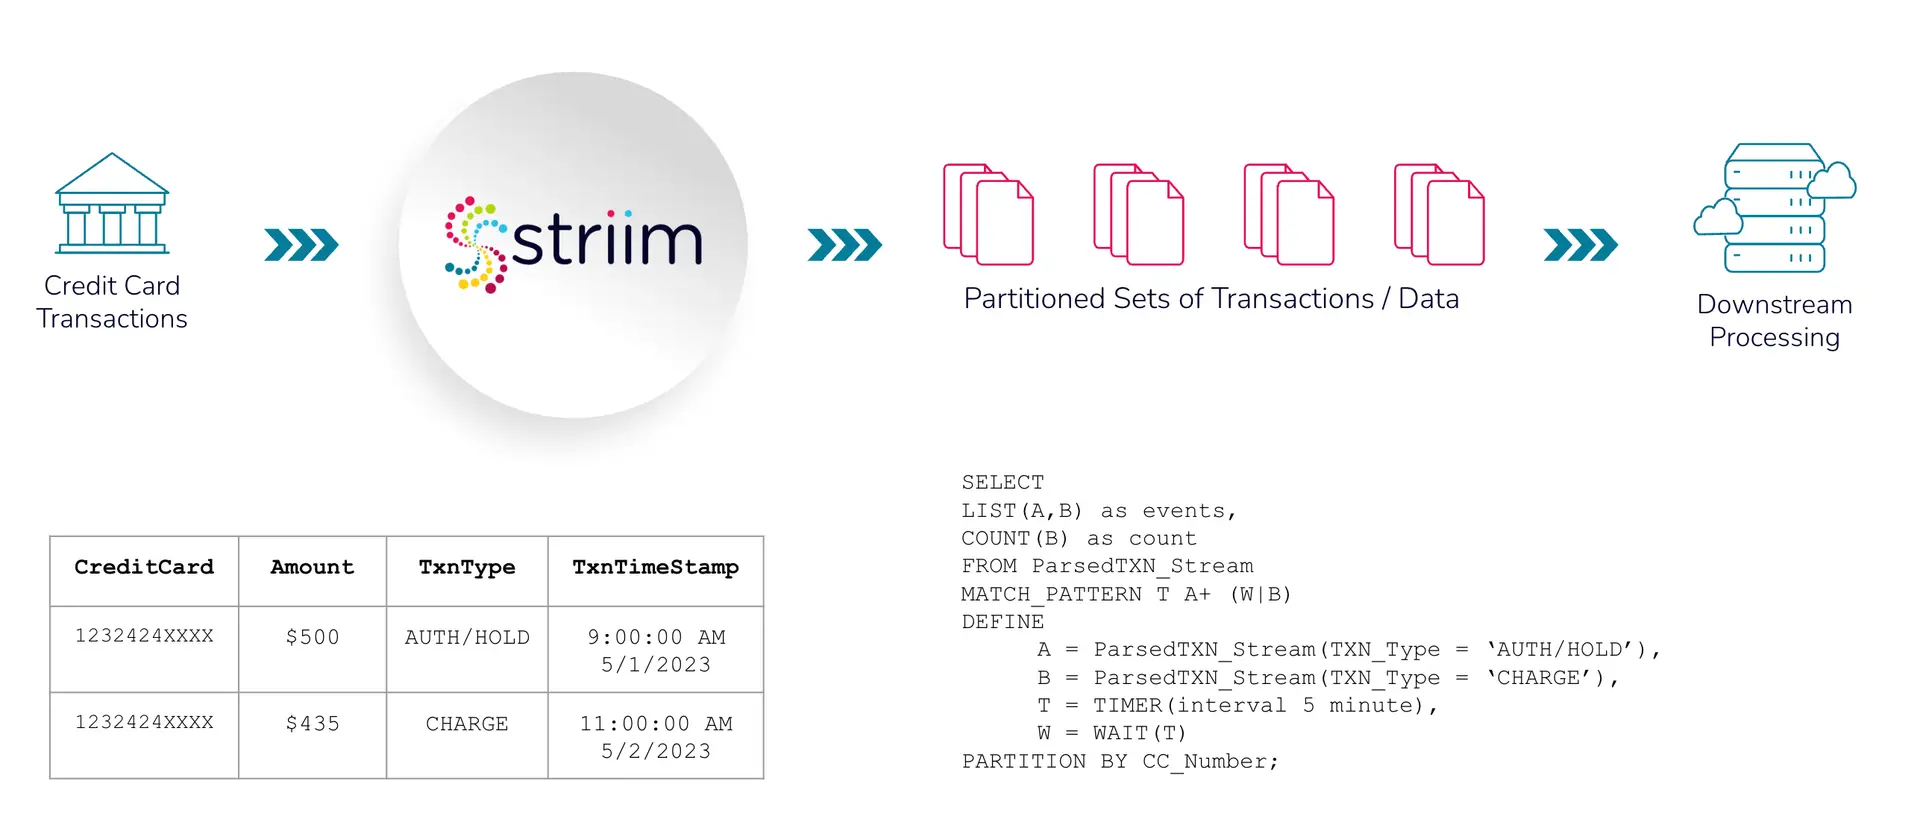
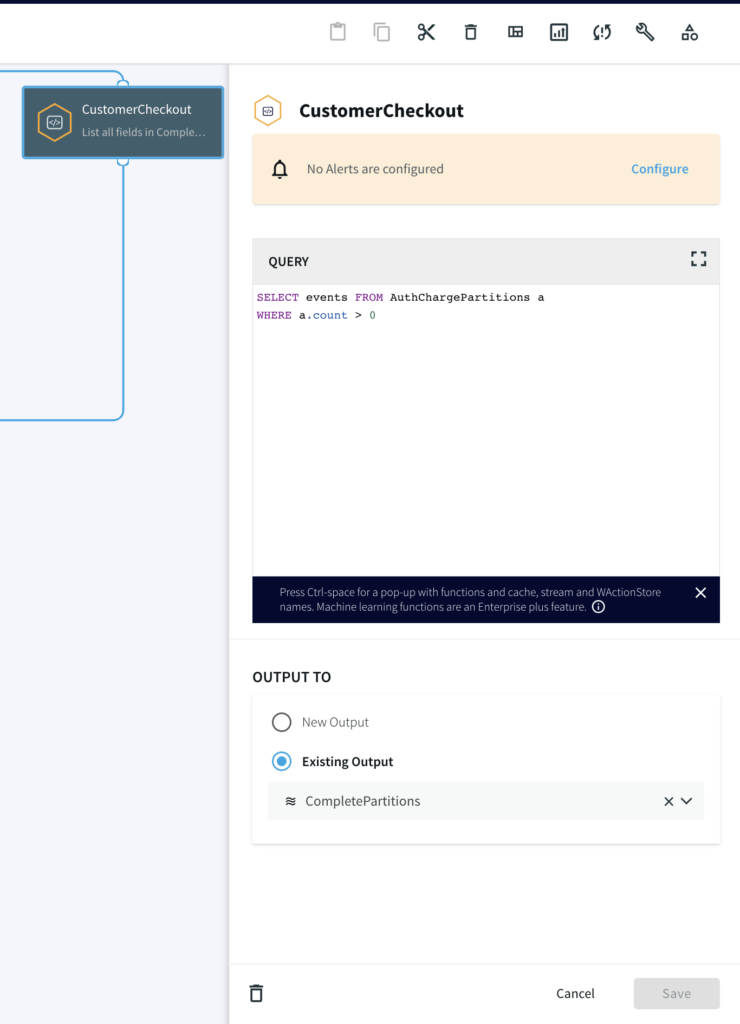
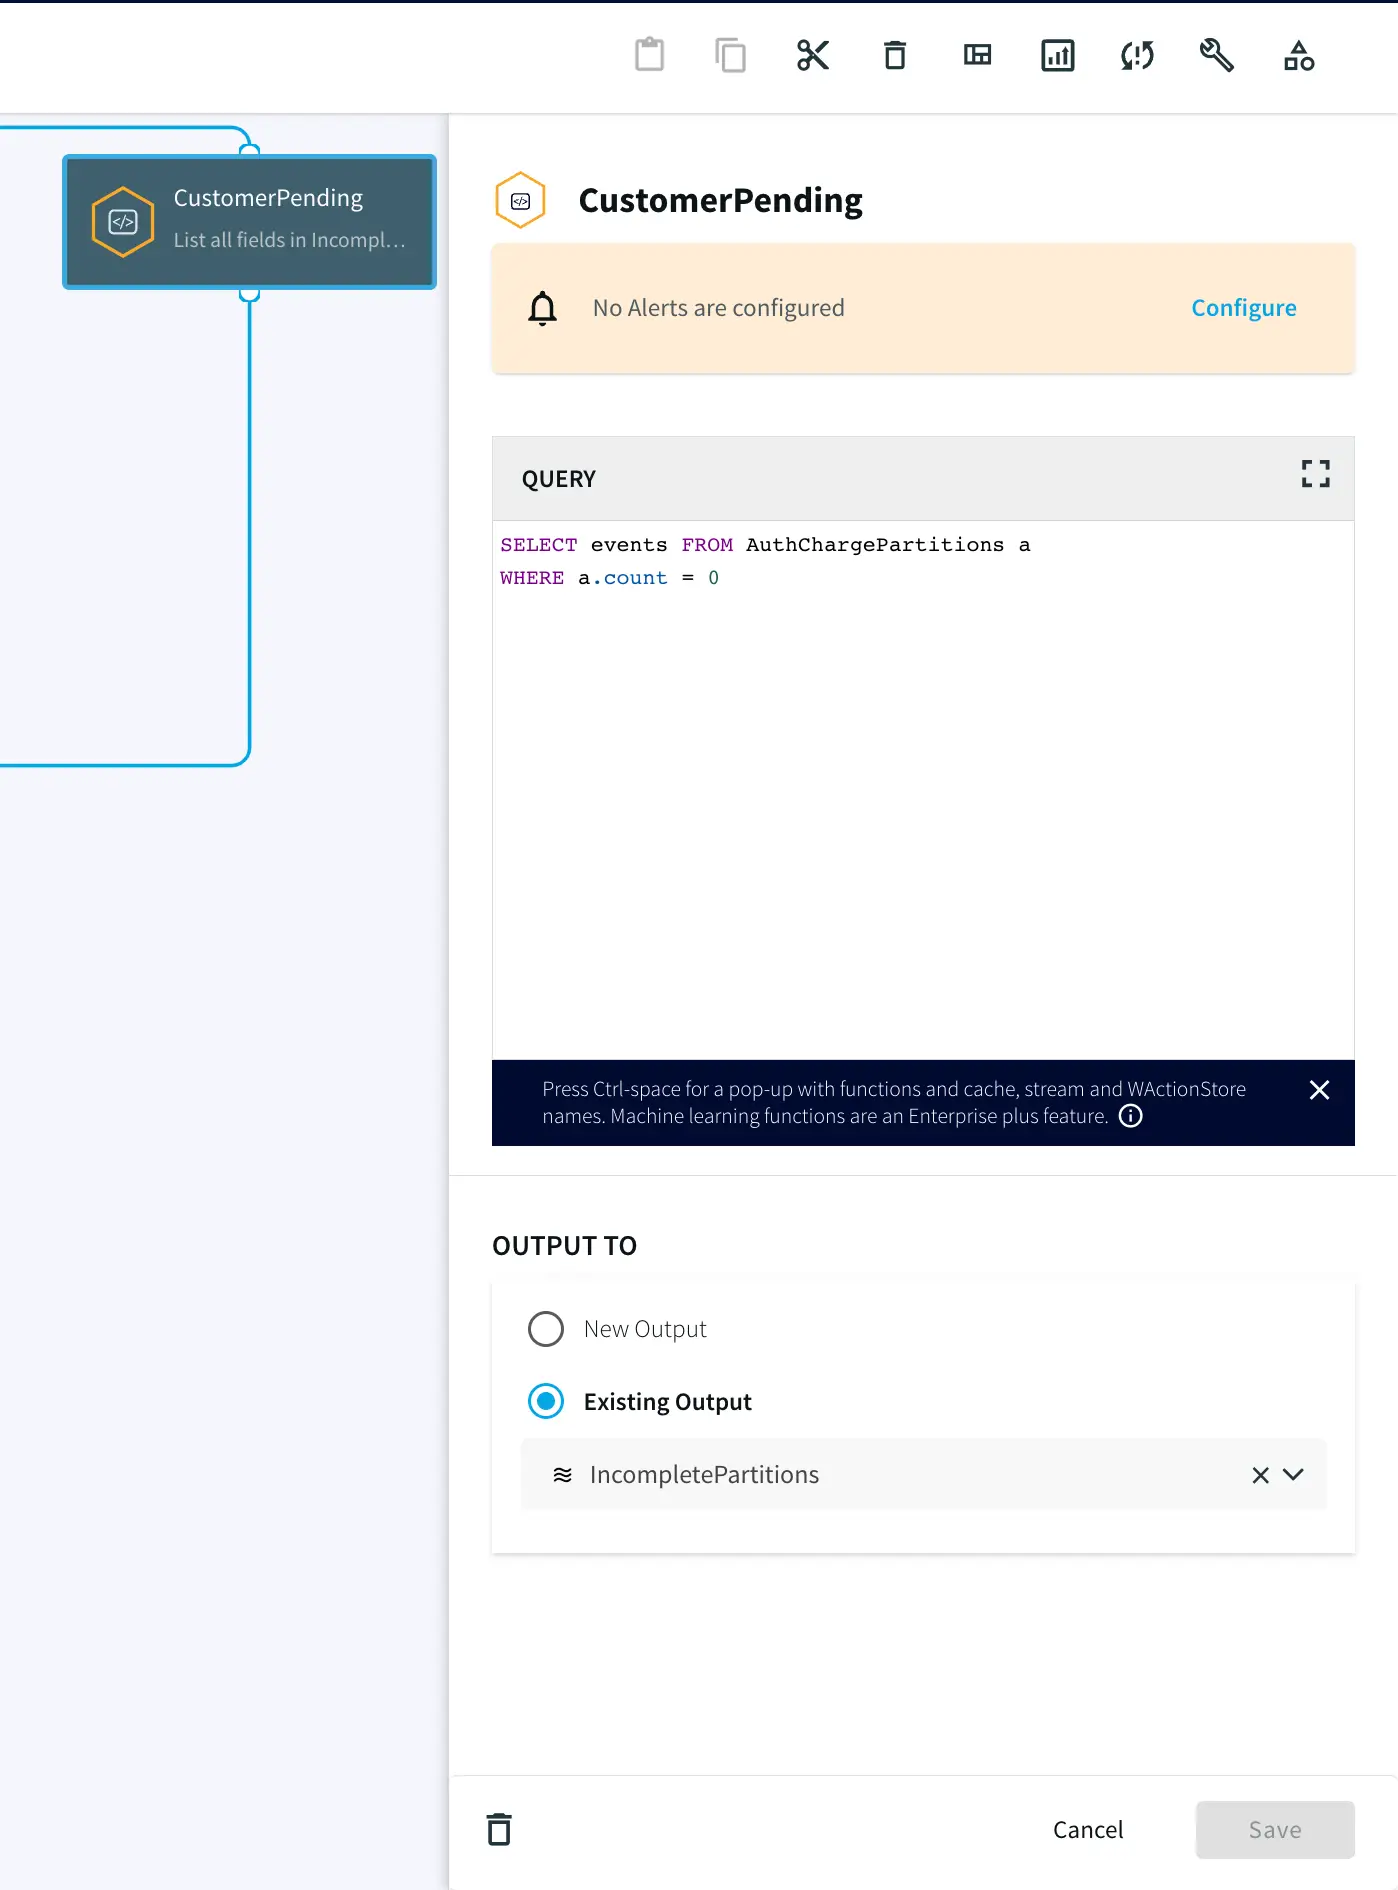
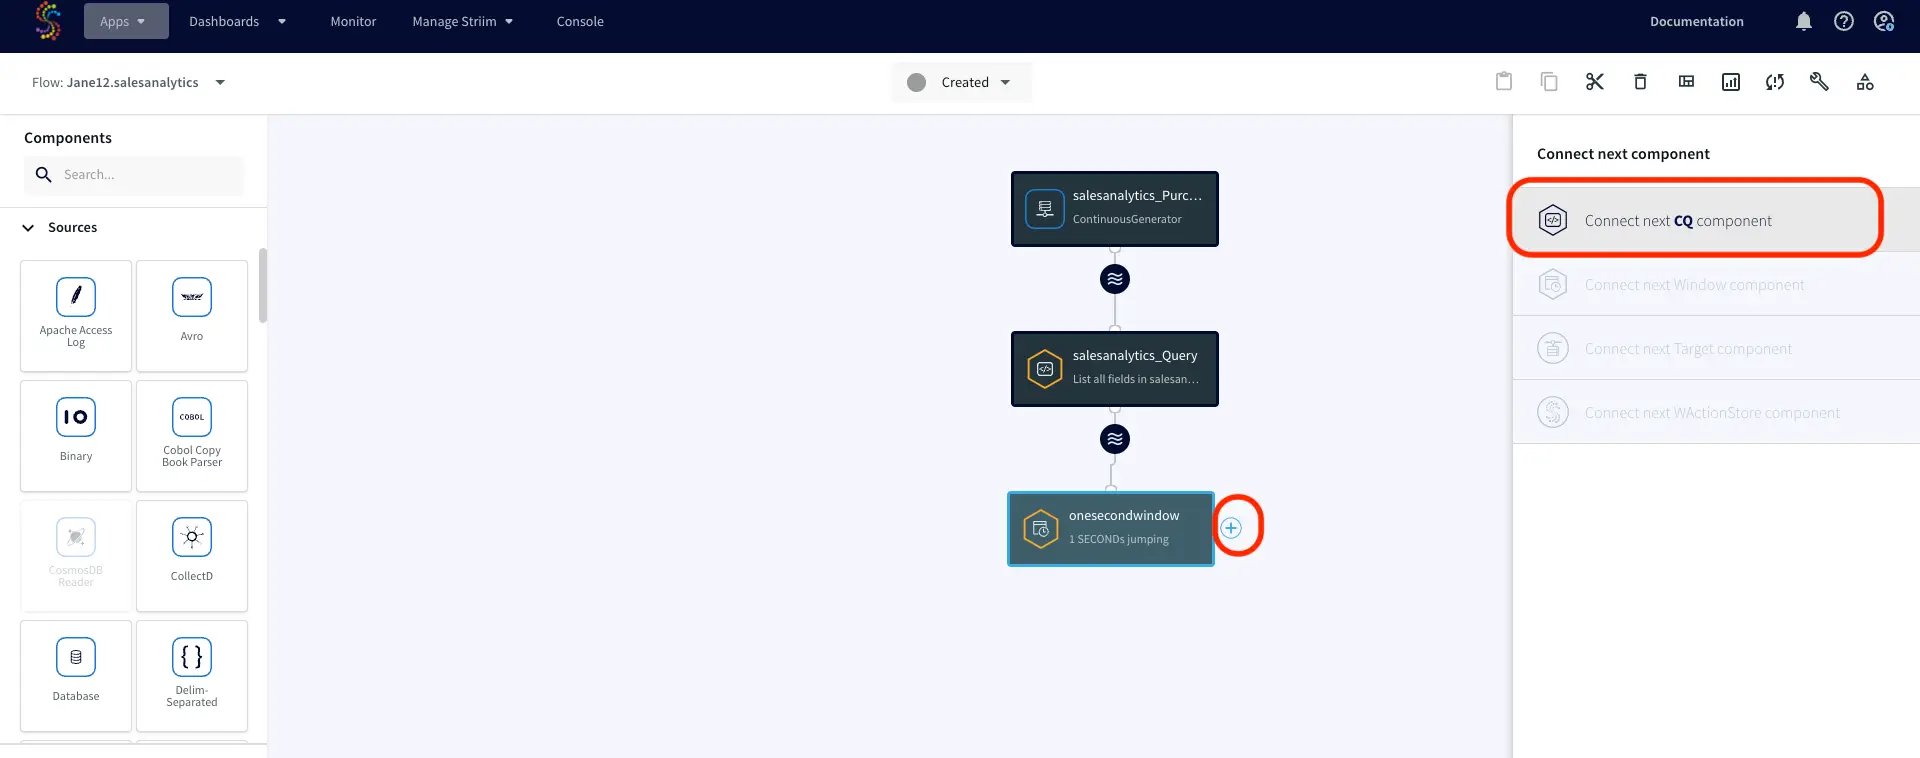
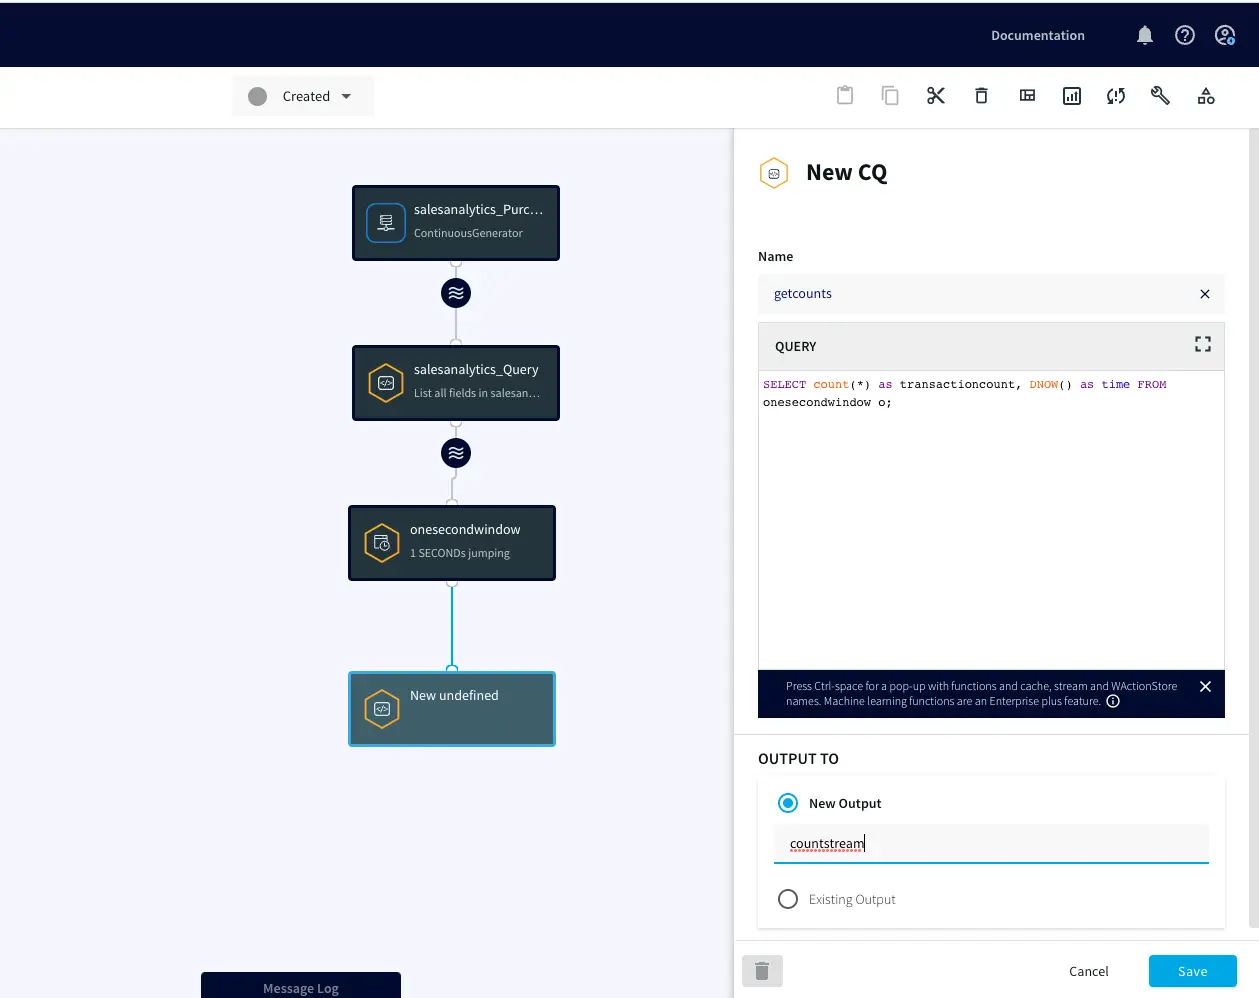
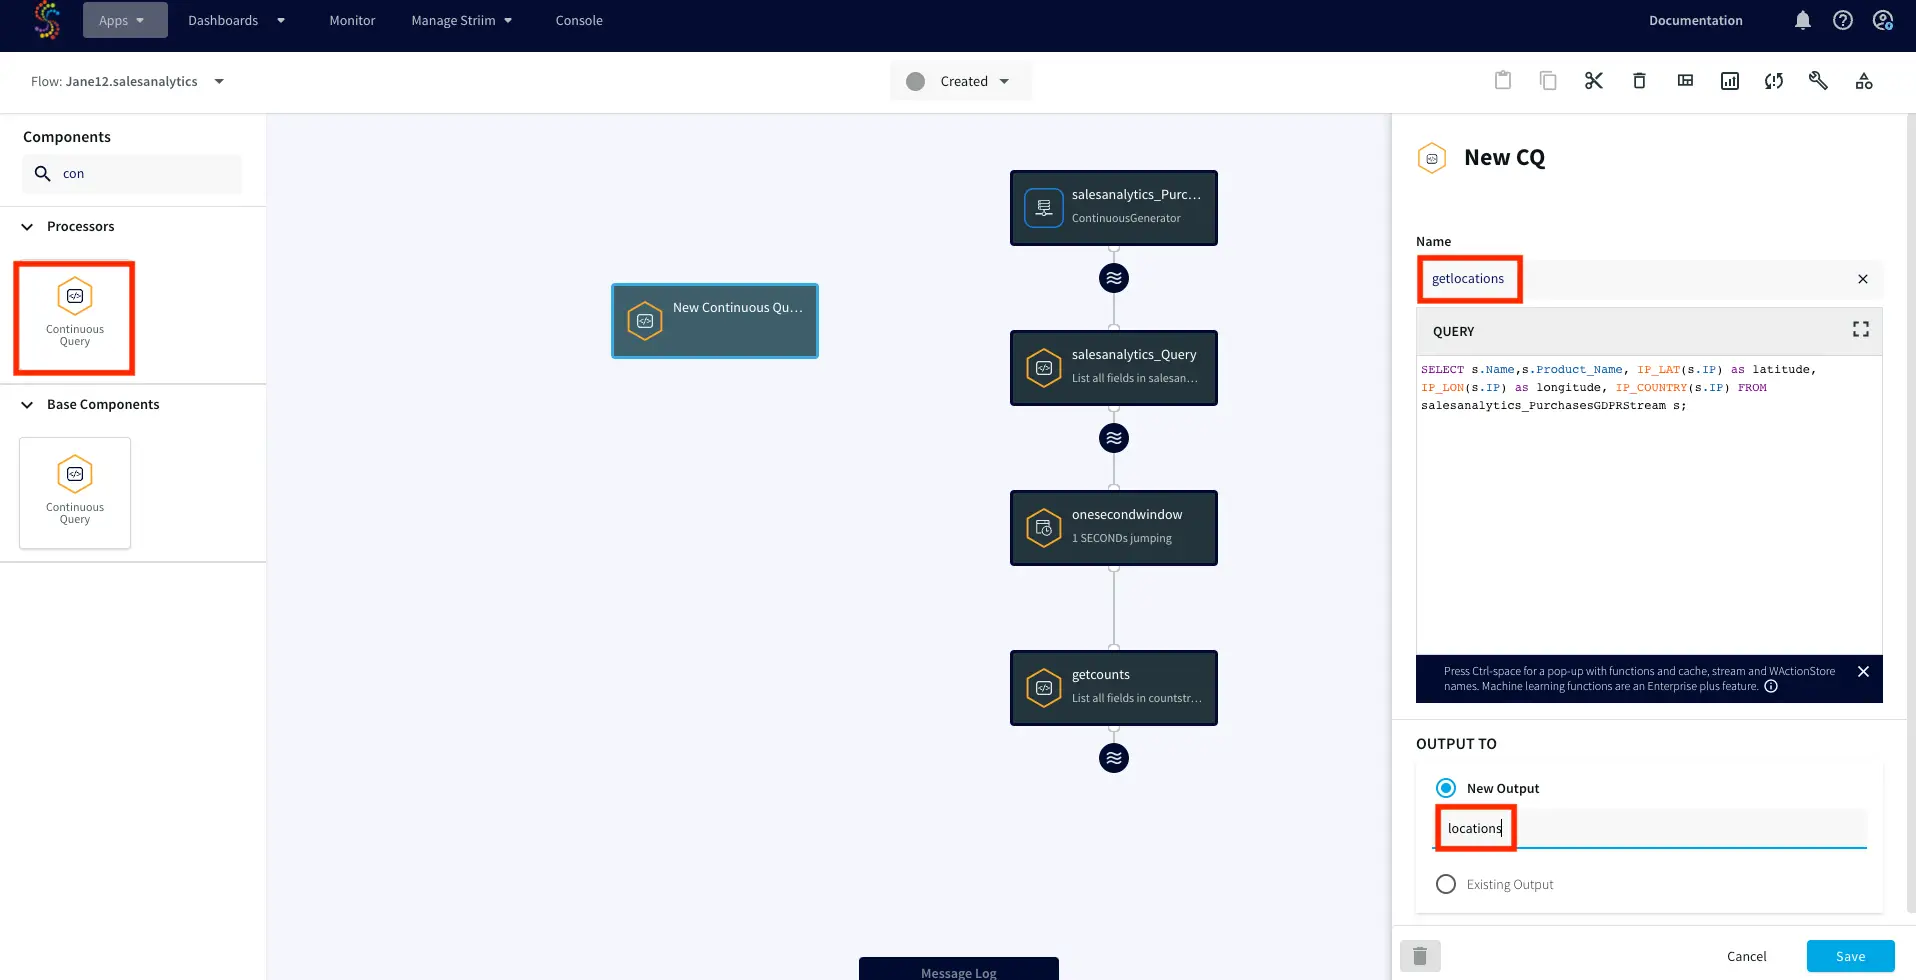
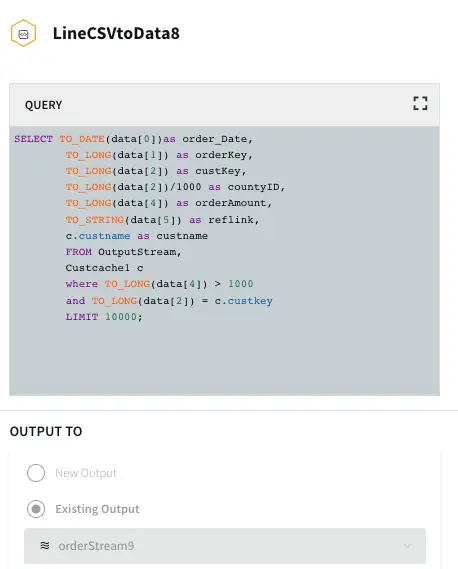
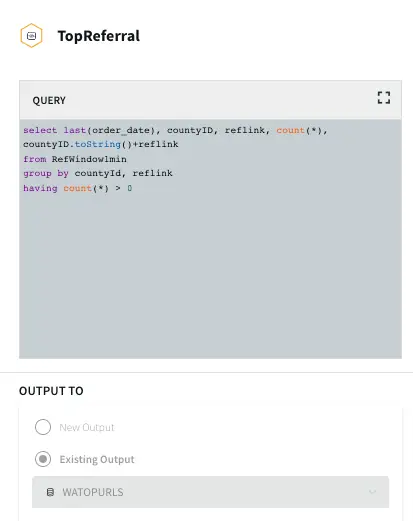
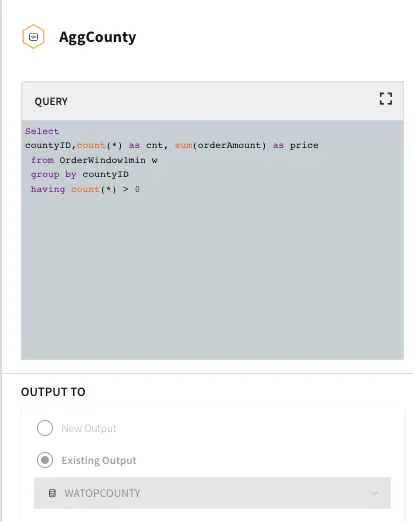
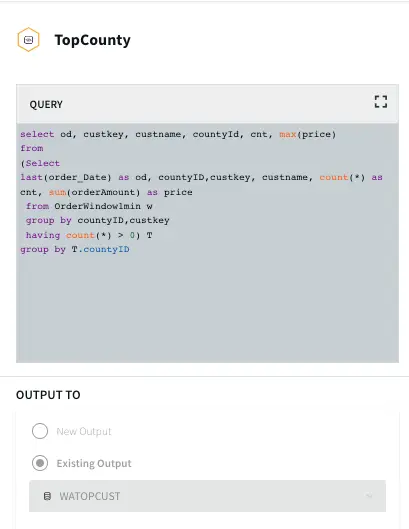
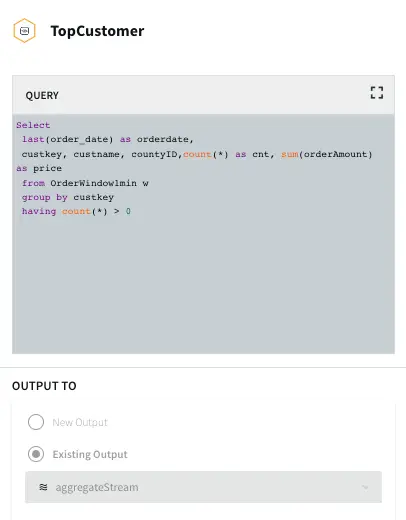
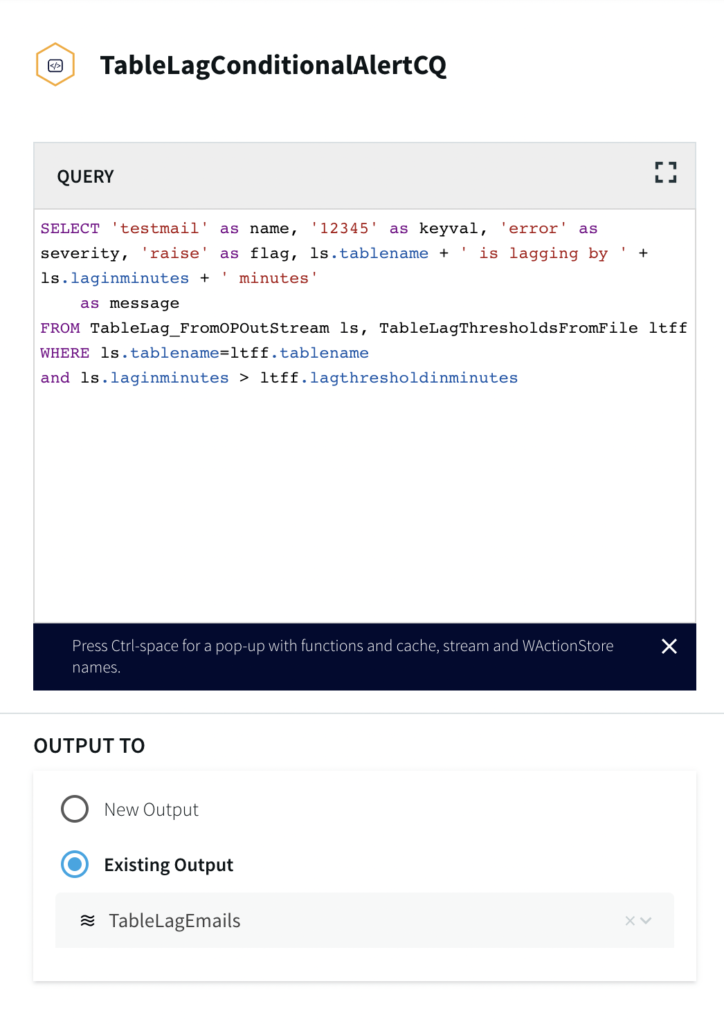
Continuous Query: Striim Continuous queries are continually running SQL queries that act on real-time data and may be used to filter, aggregate, join, enrich, and transform events.
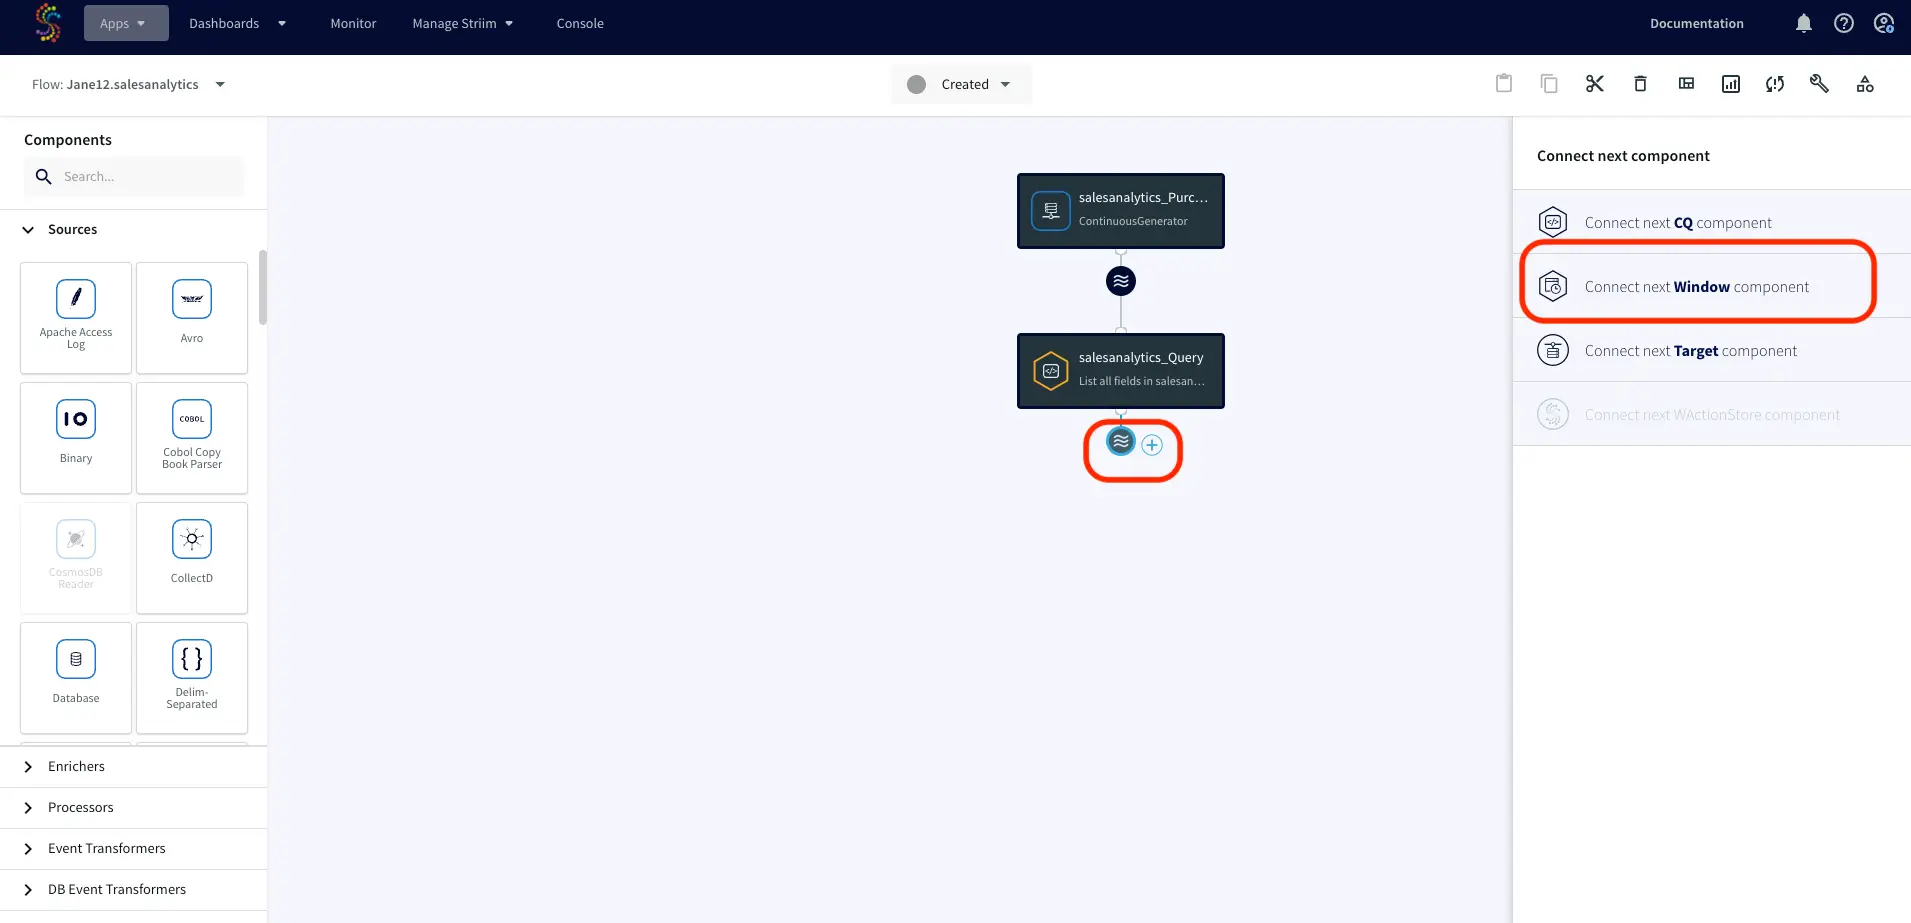
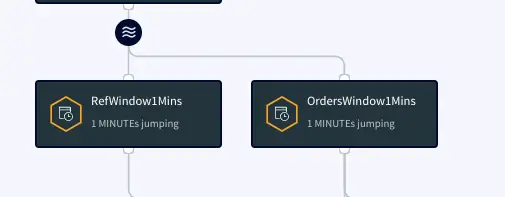
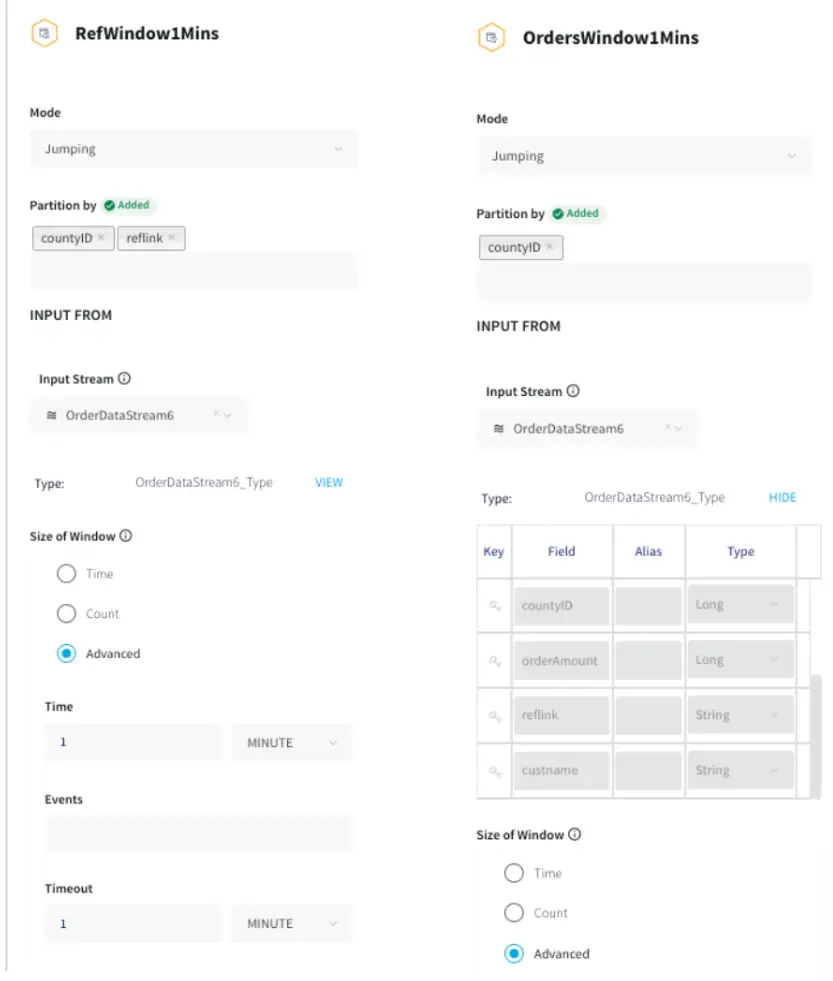
Window: A window bounds real-time data by time, event count or both. A window is required for an application to aggregate or perform calculations on data, populate the dashboard, or send alerts when conditions deviate from normal parameters.
WAction and WActionStore: A WActionStore stores event data from one or more sources based on criteria defined in one or more queries. These events may be related using common key fields.
Event Table: An event table is similar to a cache, except it is populated by an input stream instead of by an external file or database. CQs can both INSERT INTO and SELECT FROM an event table.
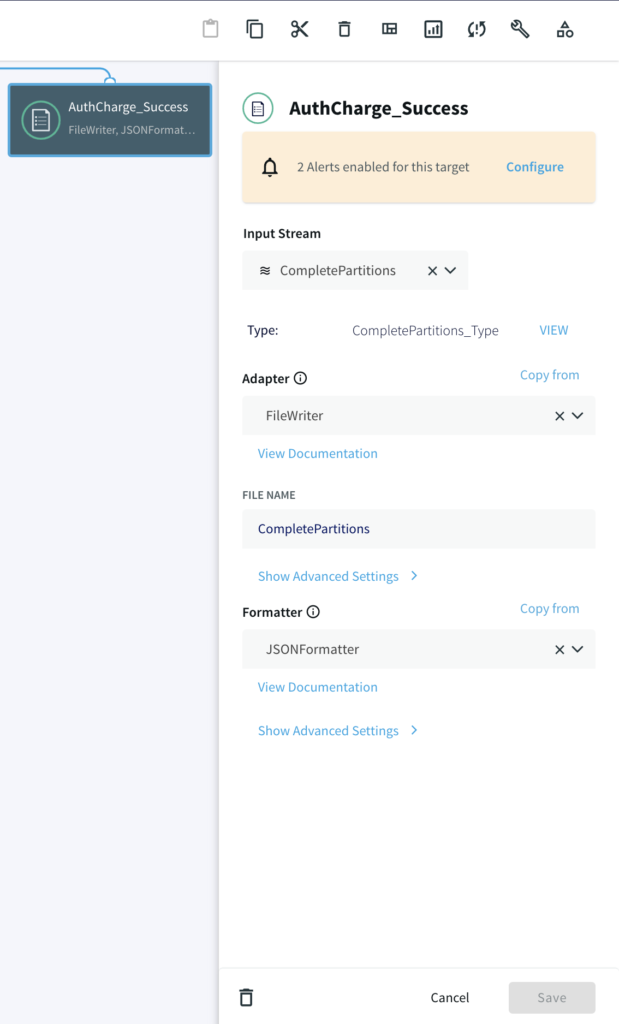
File Writer: Writes outcoming data to files
Dashboard: A Striim dashboard gives you a visual representation of data read and written by a Striim application
Loading Cache
There are five cache files used in this application. The name and details of the files are as follows:
Providers: Provider id, firstname, lastname, hospital id, providerType
Diagnoses: Diagnosis id, name
Hospitals: Hospital id, name, city, state,zip,lat,lon
Patients: Patient id, firstname, lastname, gender, age, city, state, zip, lat, lon
Rooms: Room id, name, hospitalid, roomtype
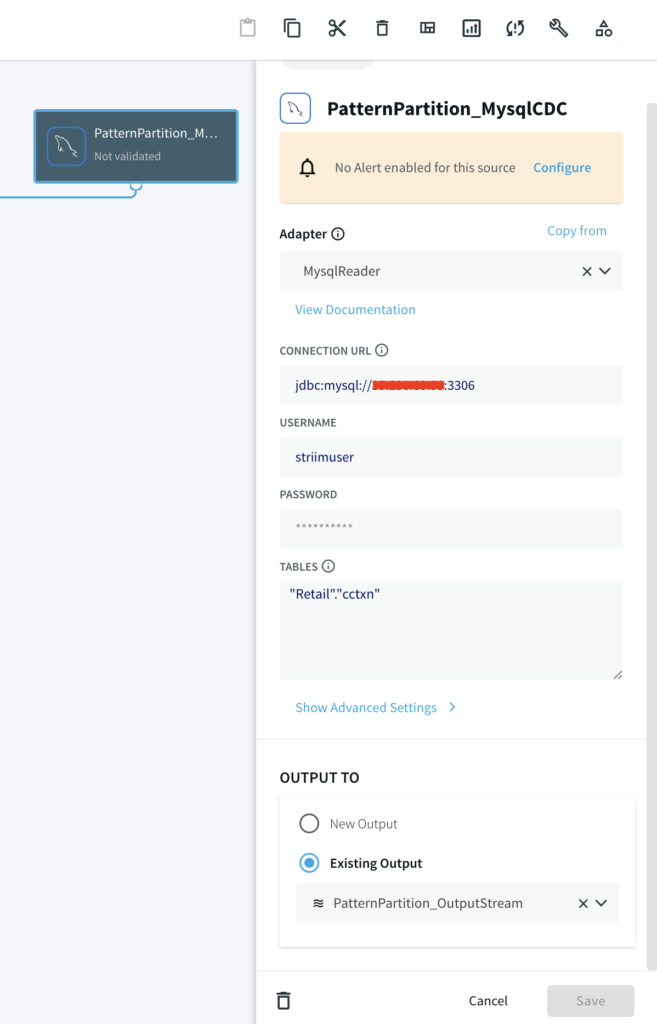
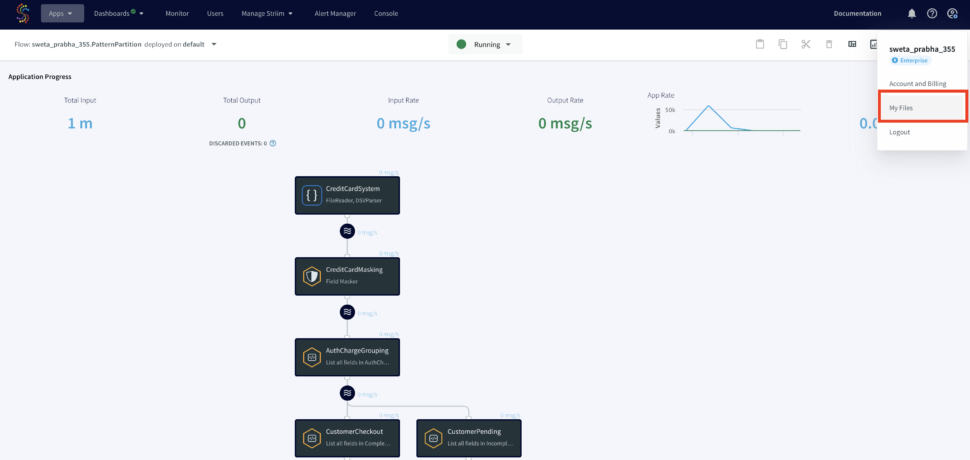
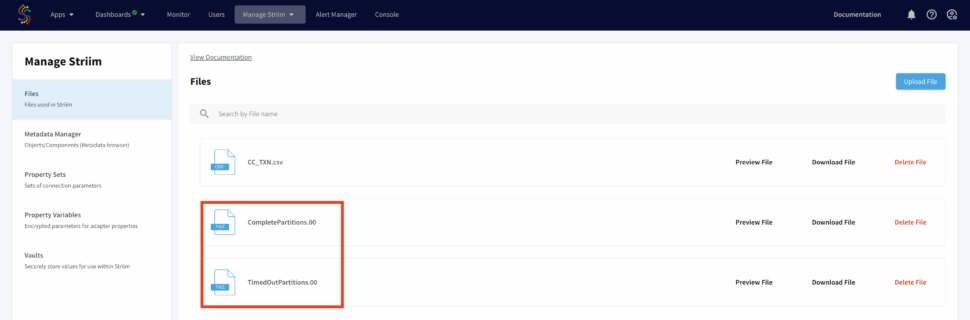
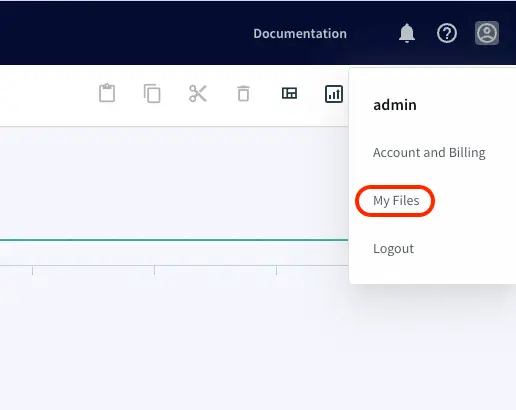
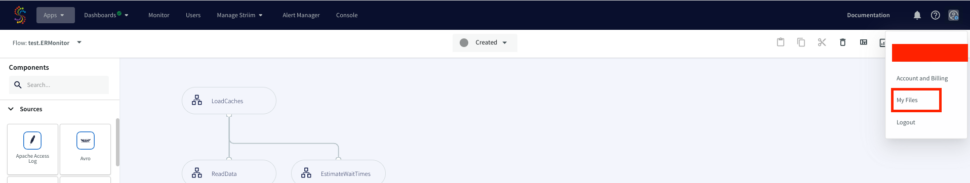
Choose ‘My files’ from the drop-down on the upper right corner and upload the cache files that you have downloaded from the github repository.
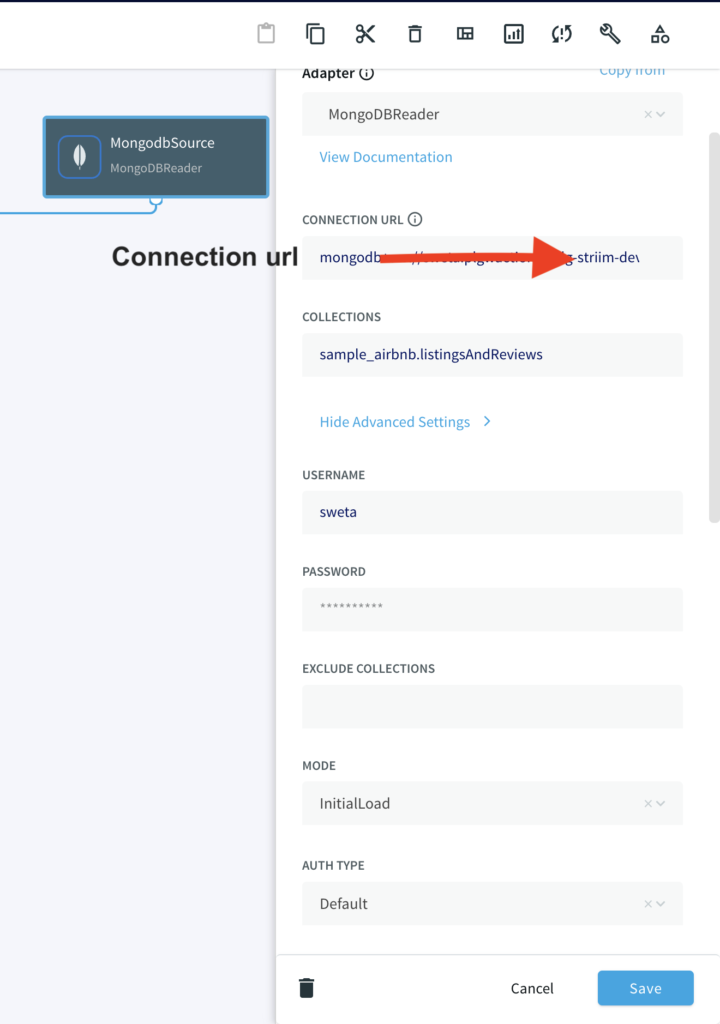
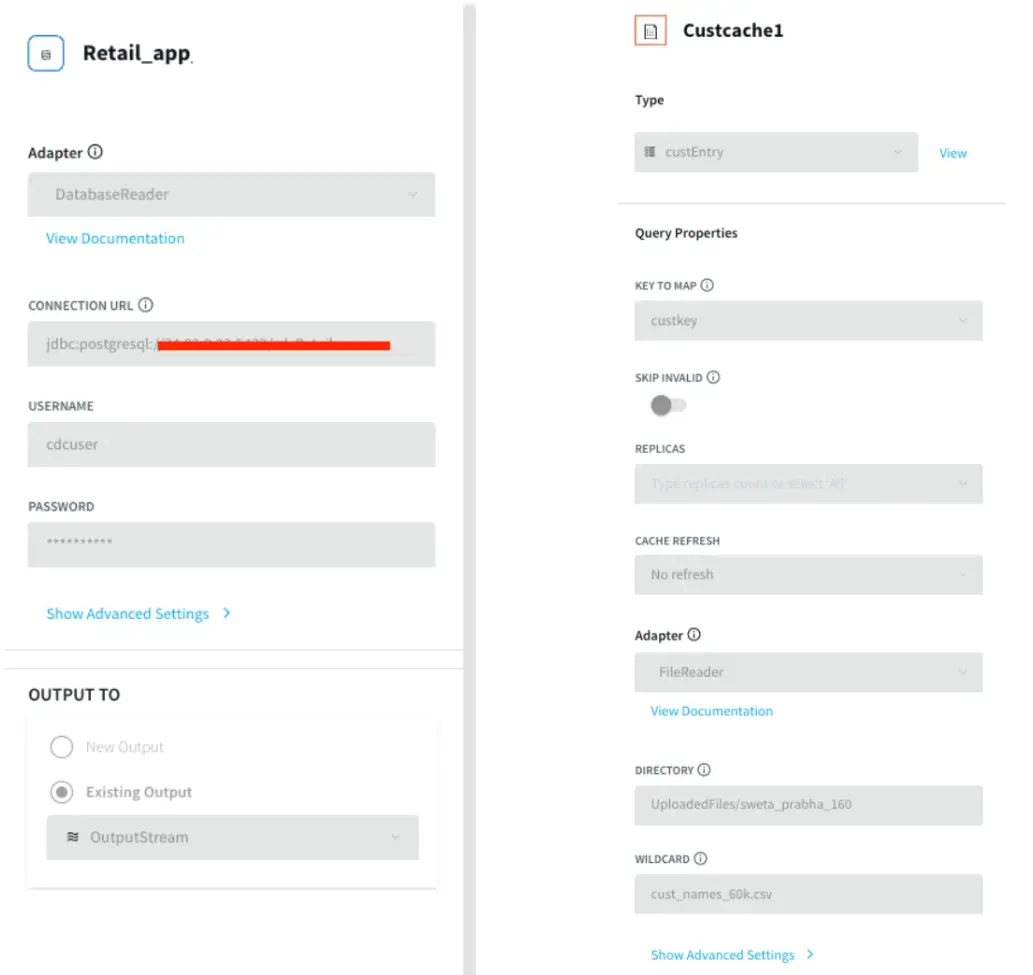
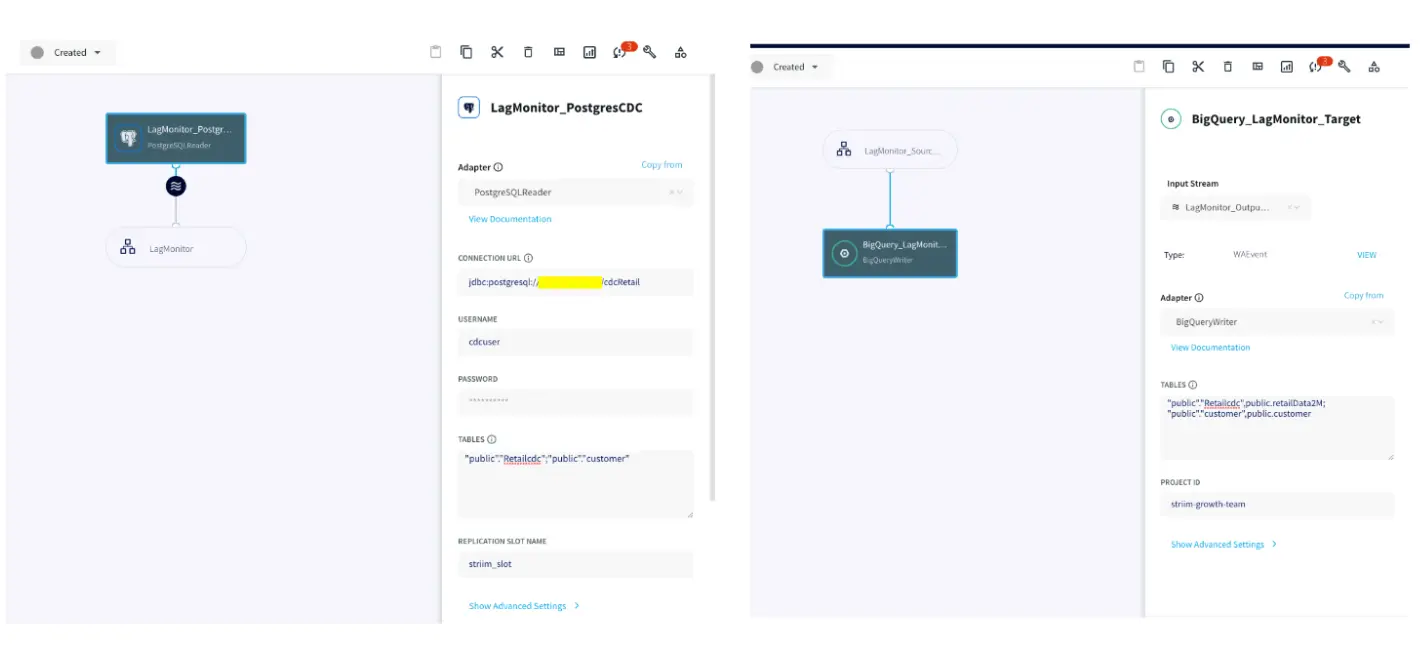
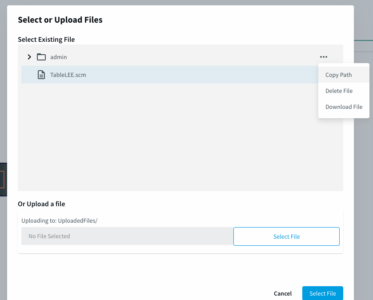
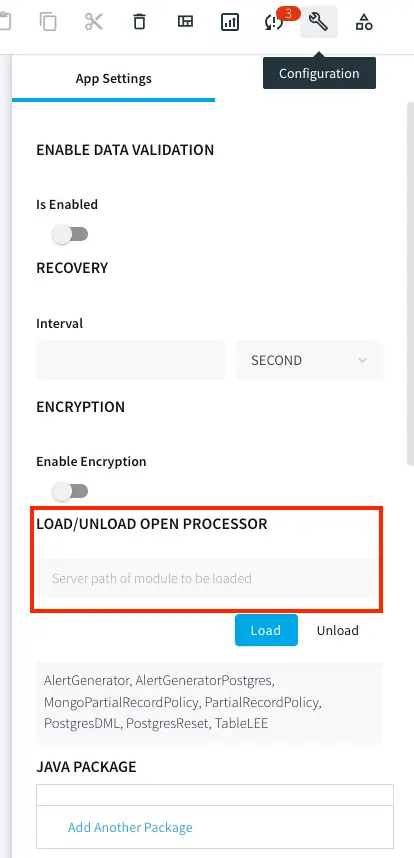
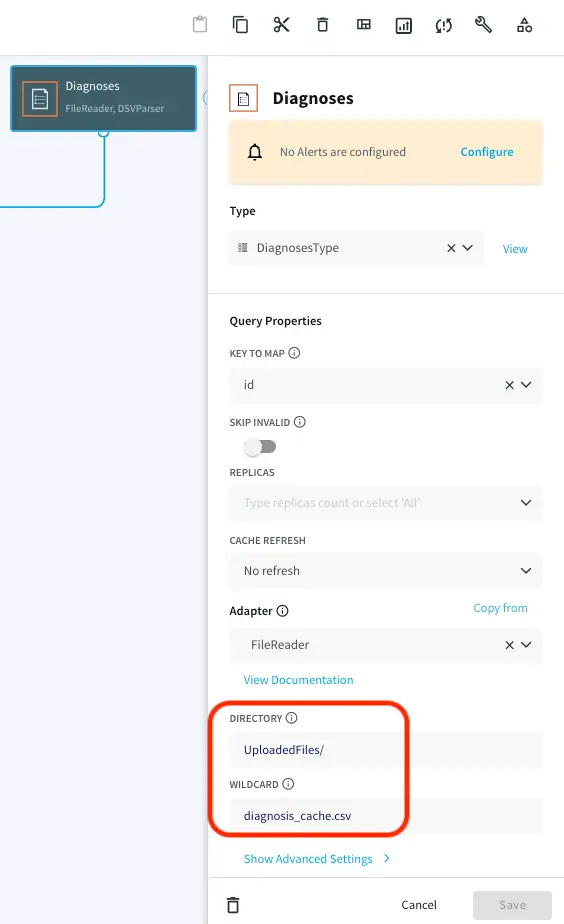
Note the path of the file and make necessary changes as shown below. Repeat this for all the five caches.
Streaming Real-Time Data
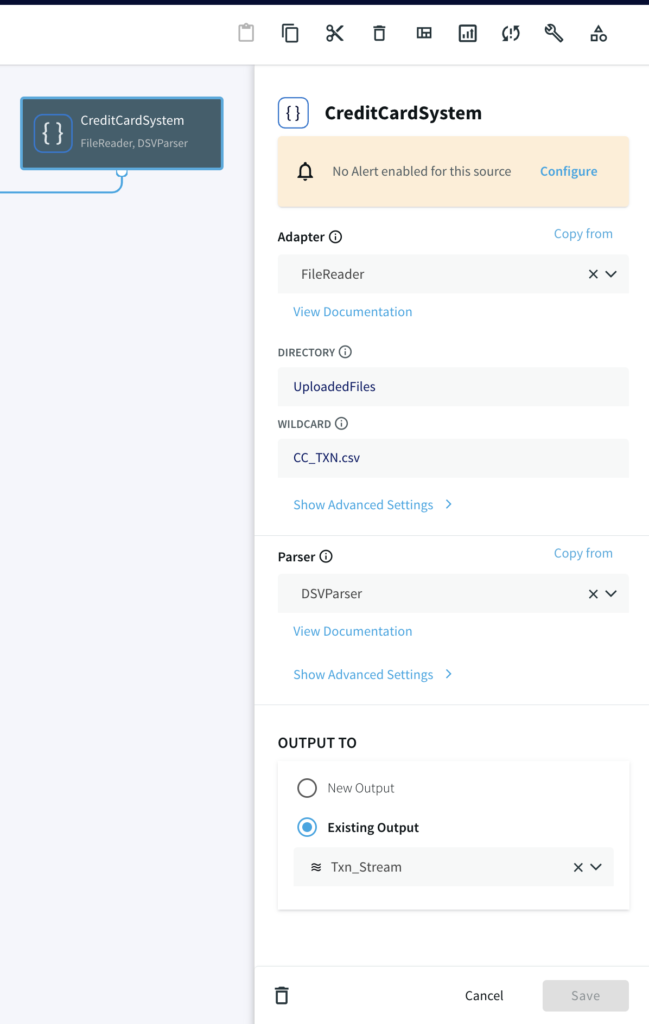
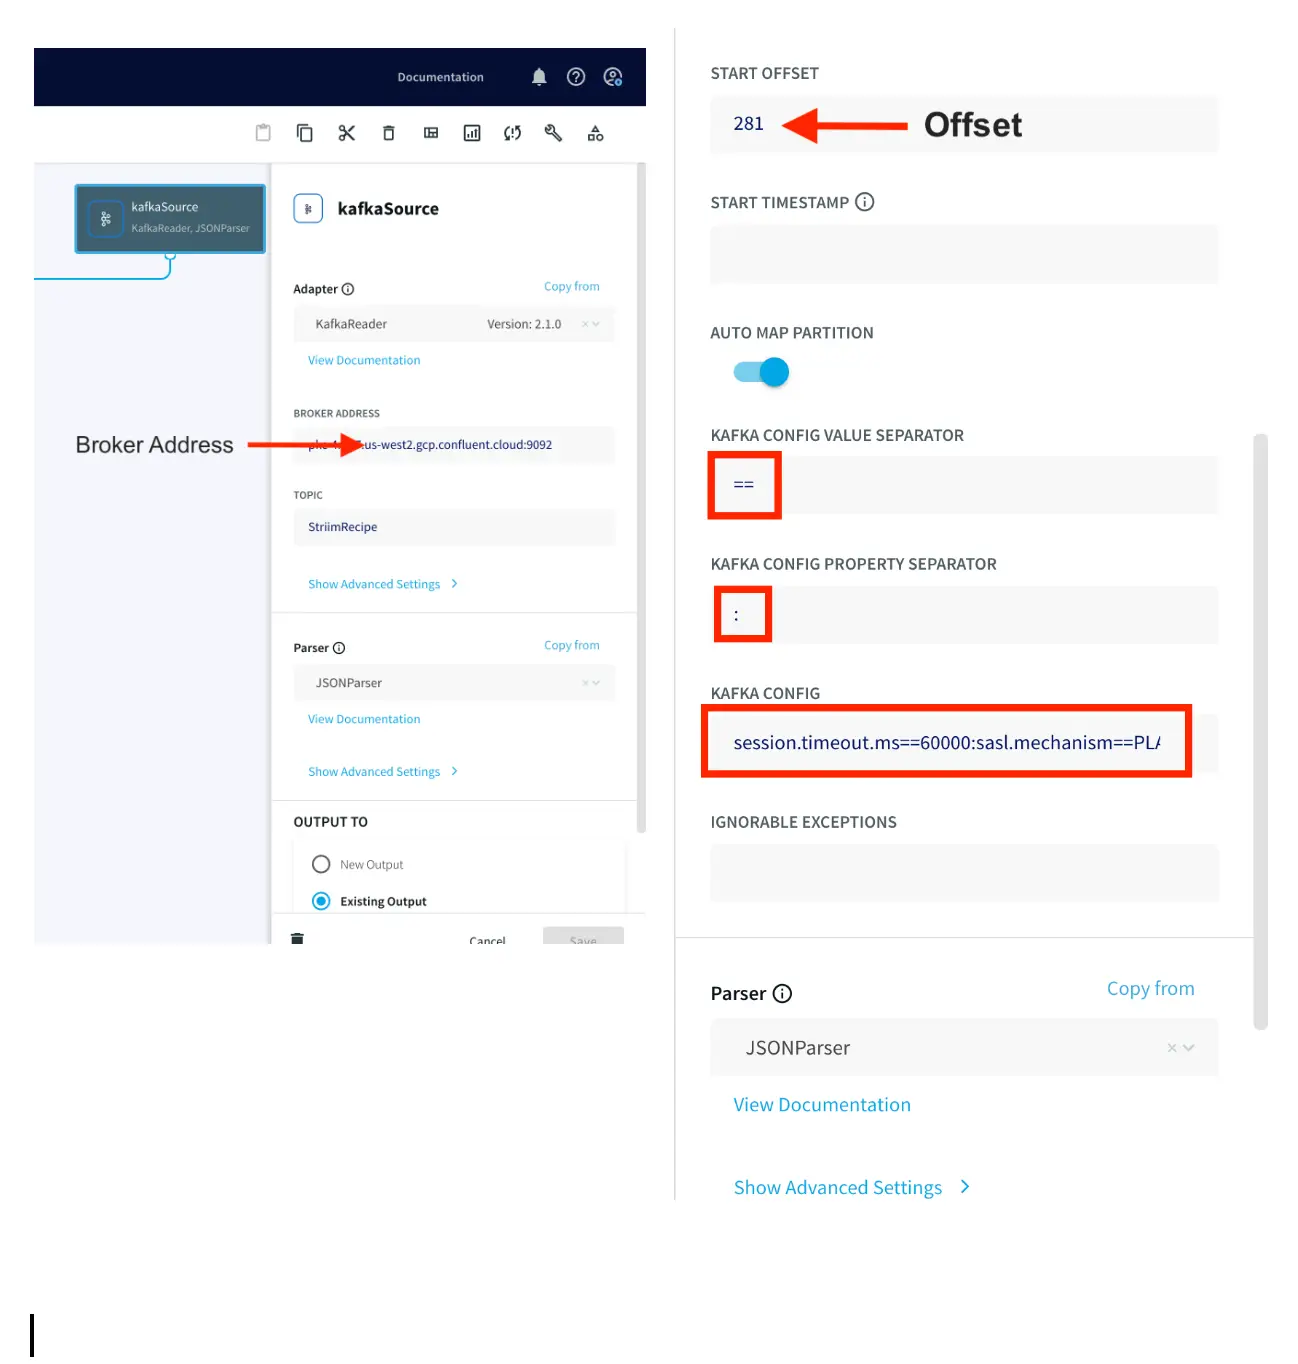
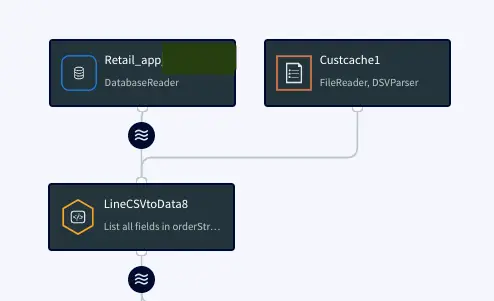
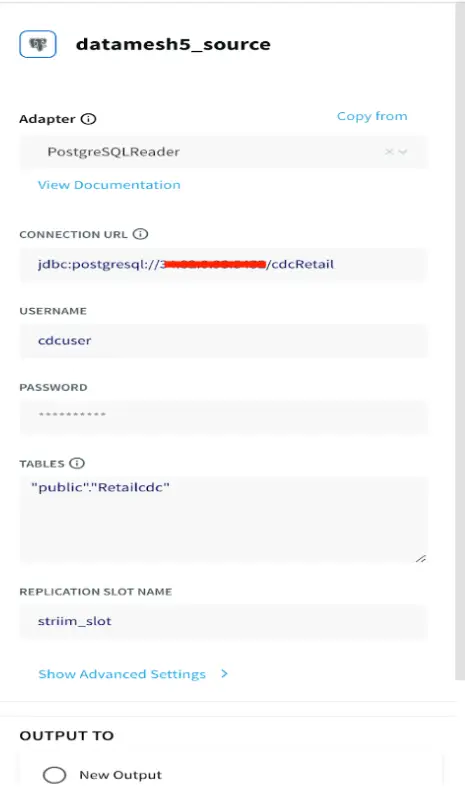
A CSV file containing patient visit data with timestamp is provided on the github repository. Upload the file in the same way as you uploaded the cache files in the previous section. Note the path of directory and edit the filereader component that reads the data as shown below: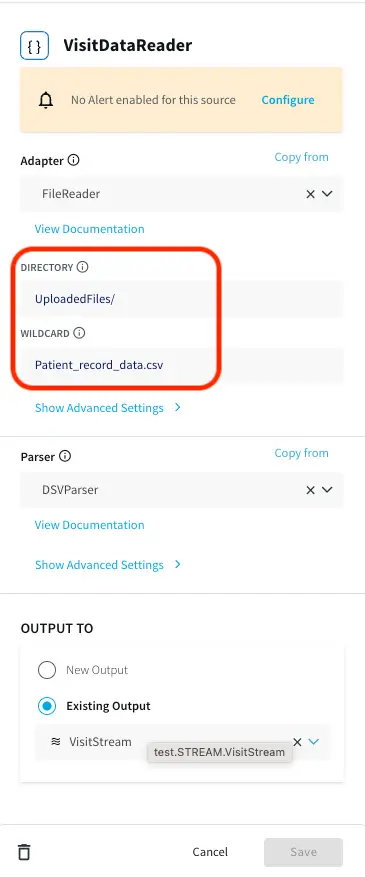
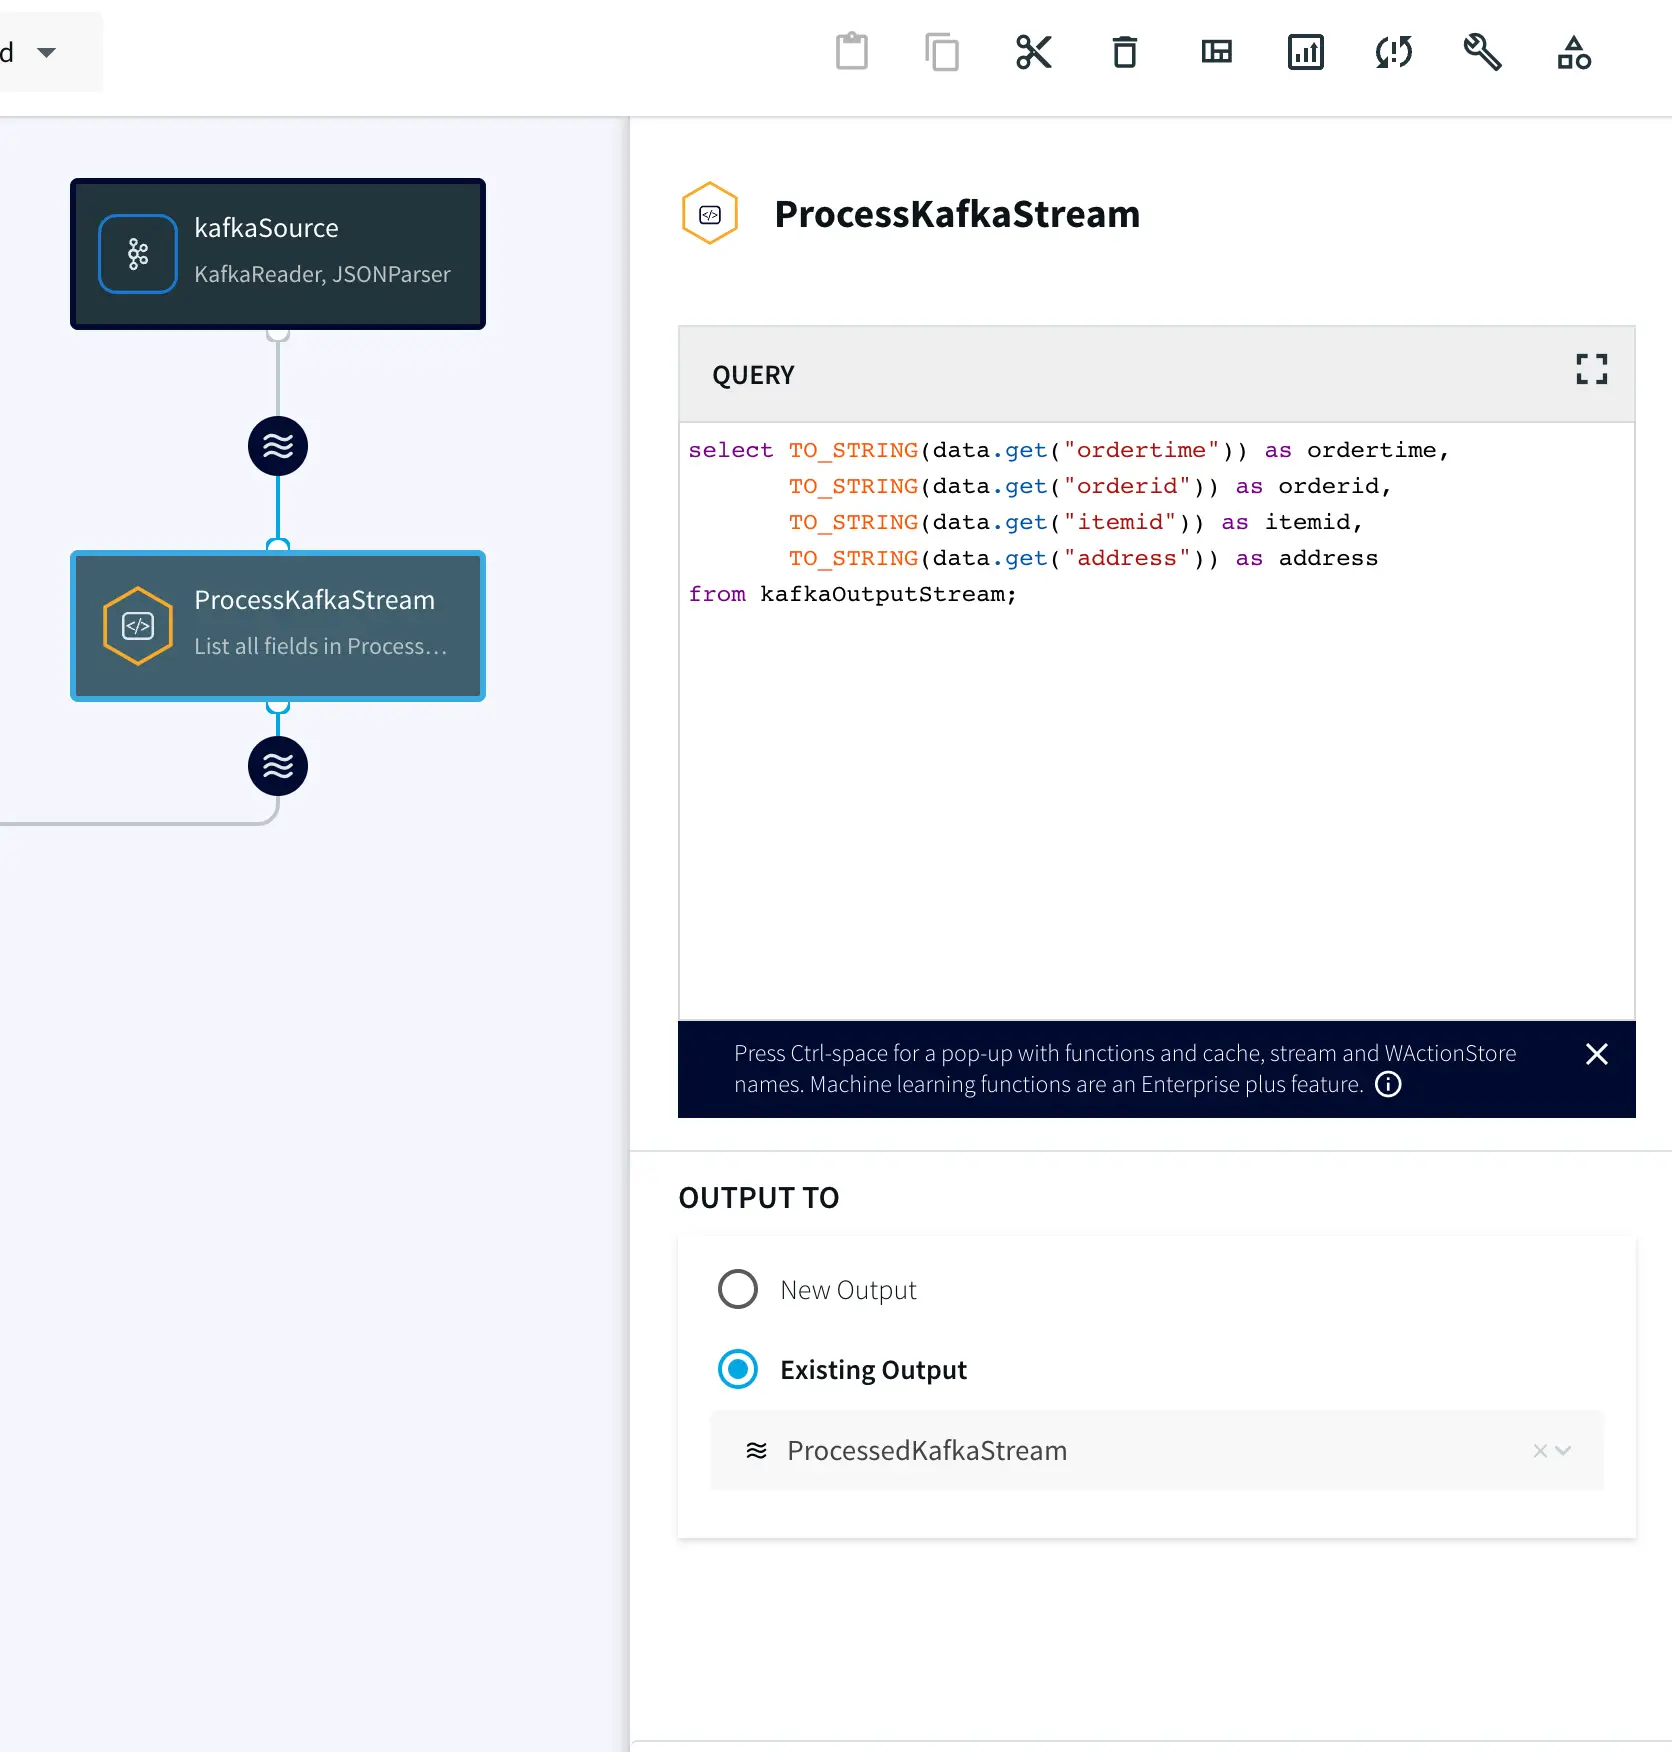
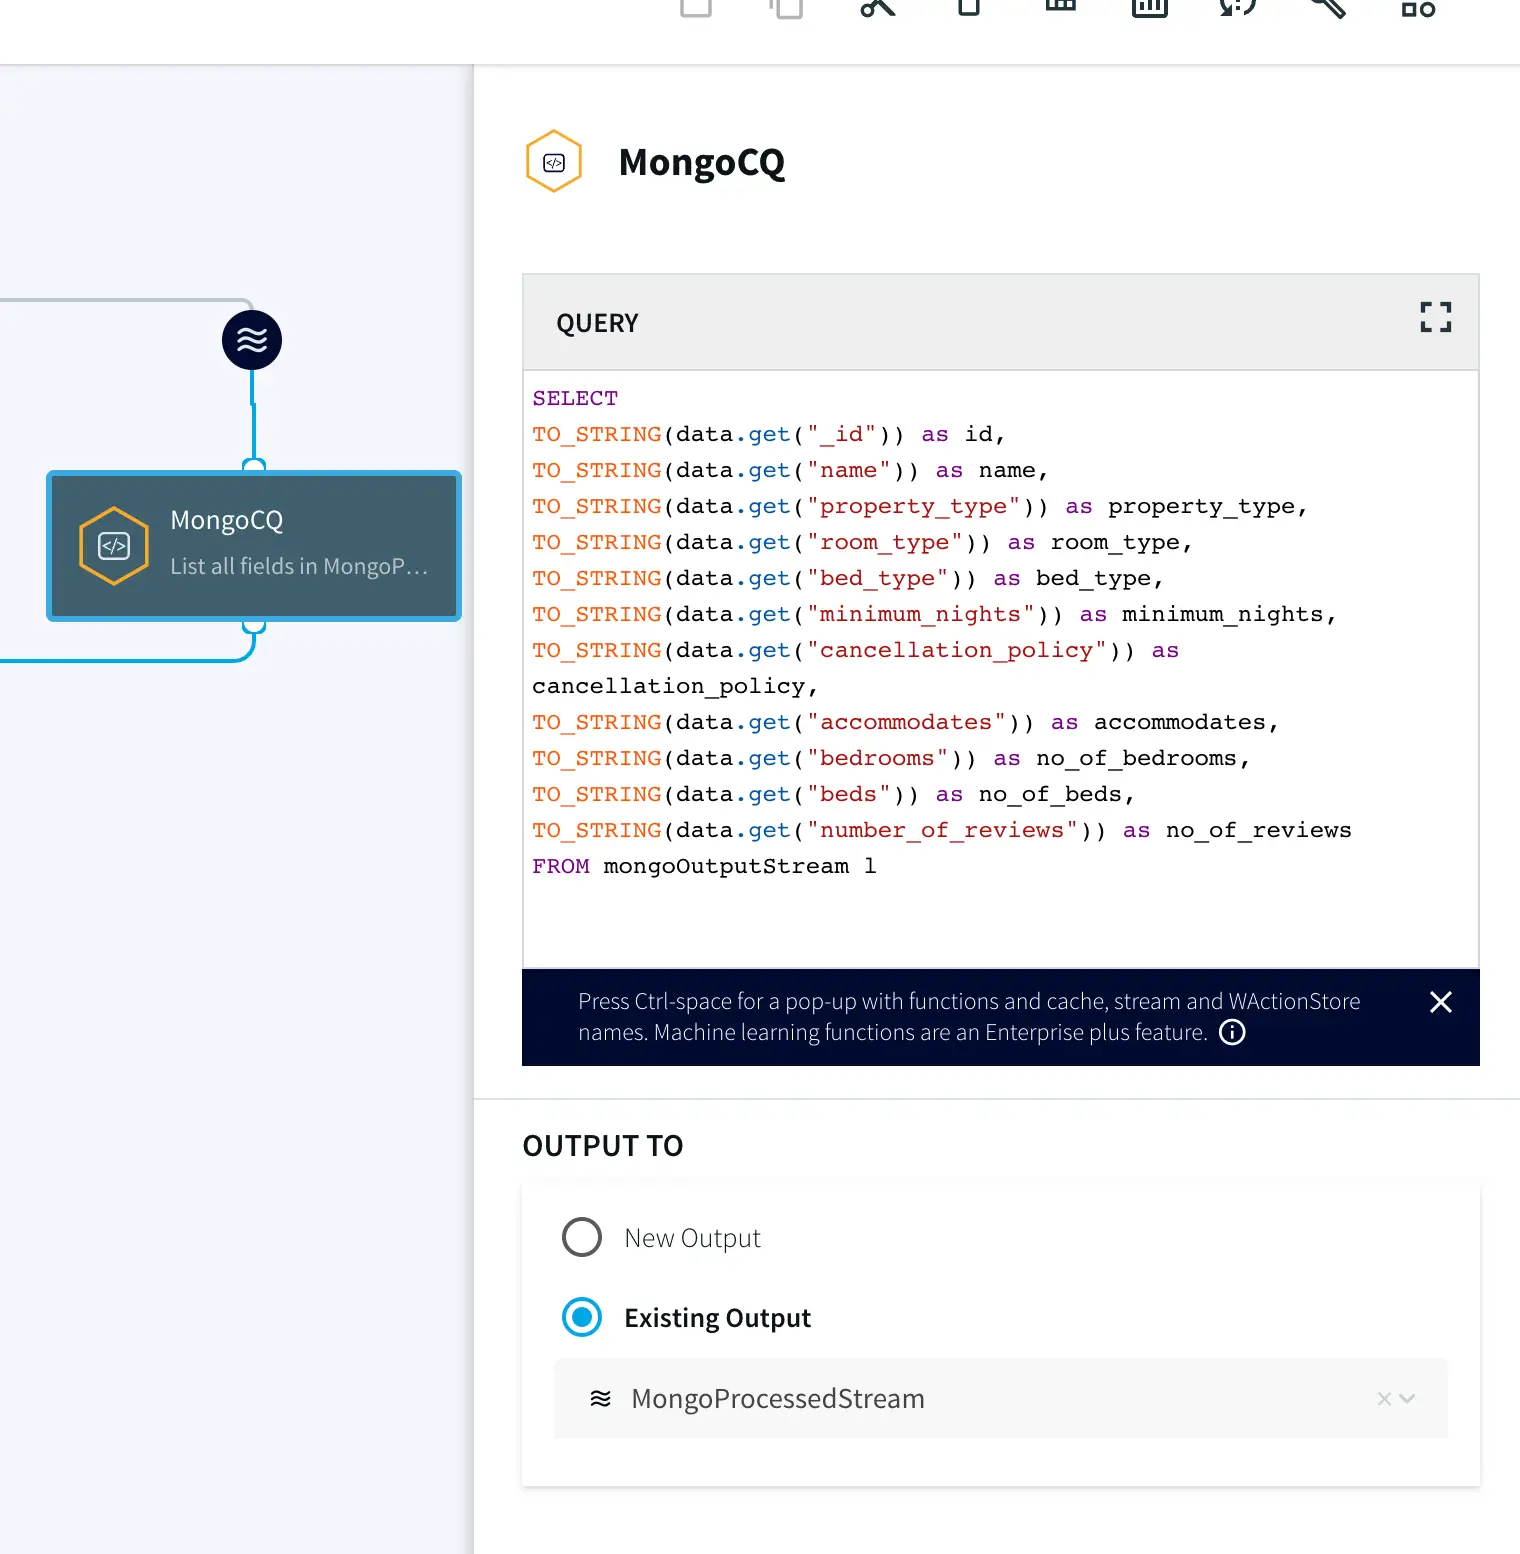
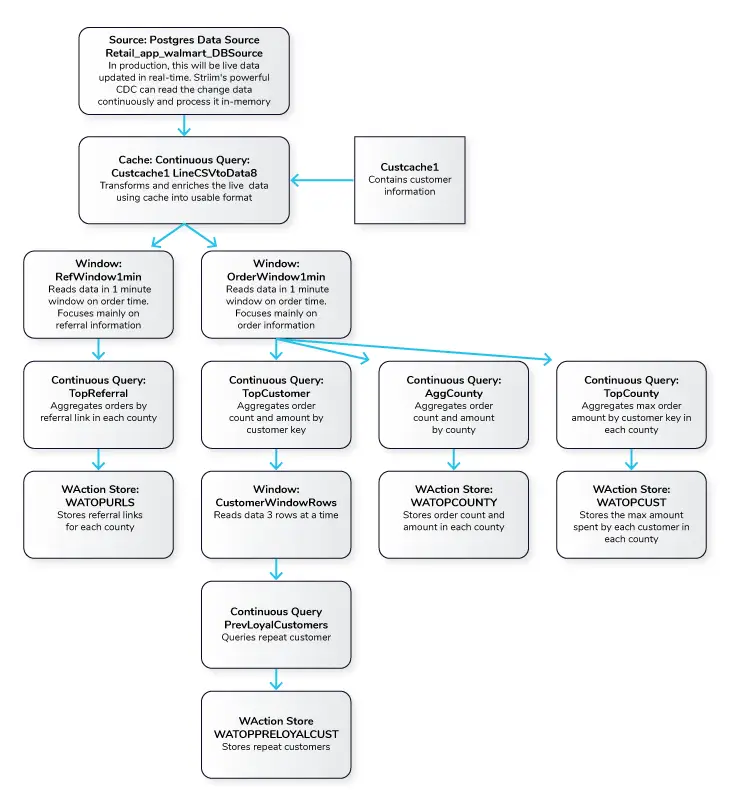
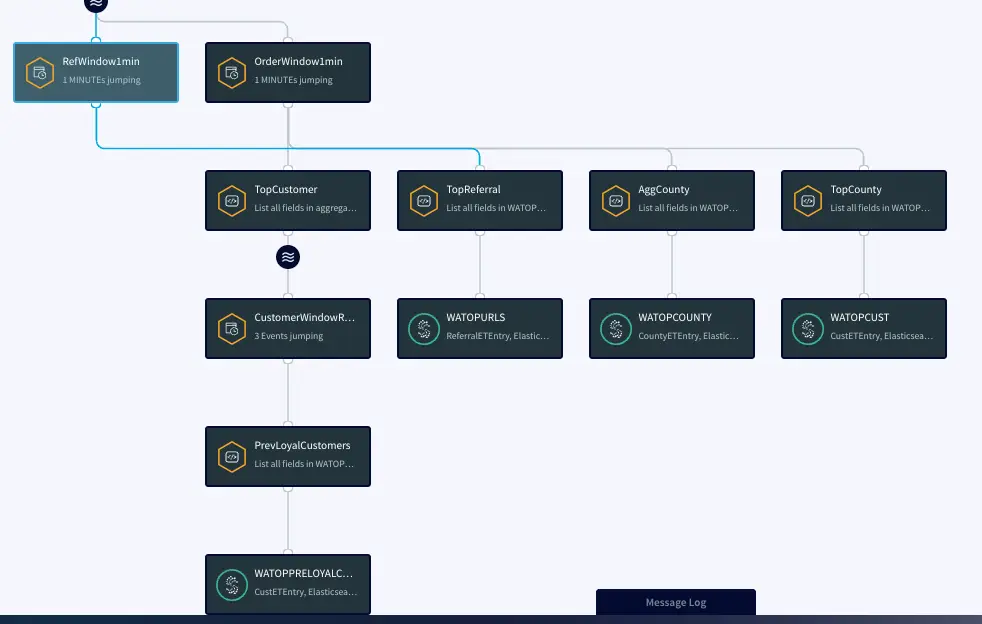
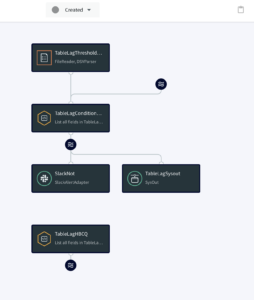
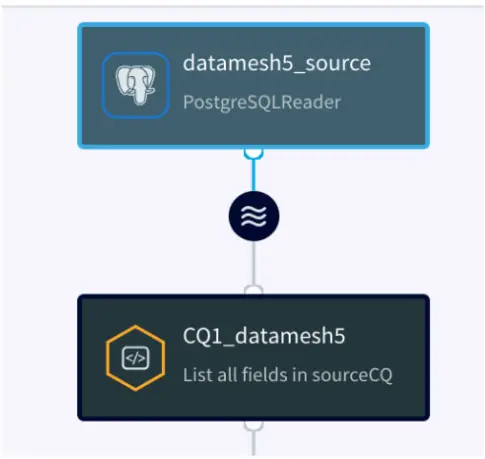
Three Continuous Queries (CQ), ParseVisitData, EnrichVisitData and AddOuterJoinsToVisitData are applied to parse the real-time data and enrich and join with cache. The queries are provided in the TQL file. The processed data is input into ER Monitor as well as Wait Time Monitor for further analytics.
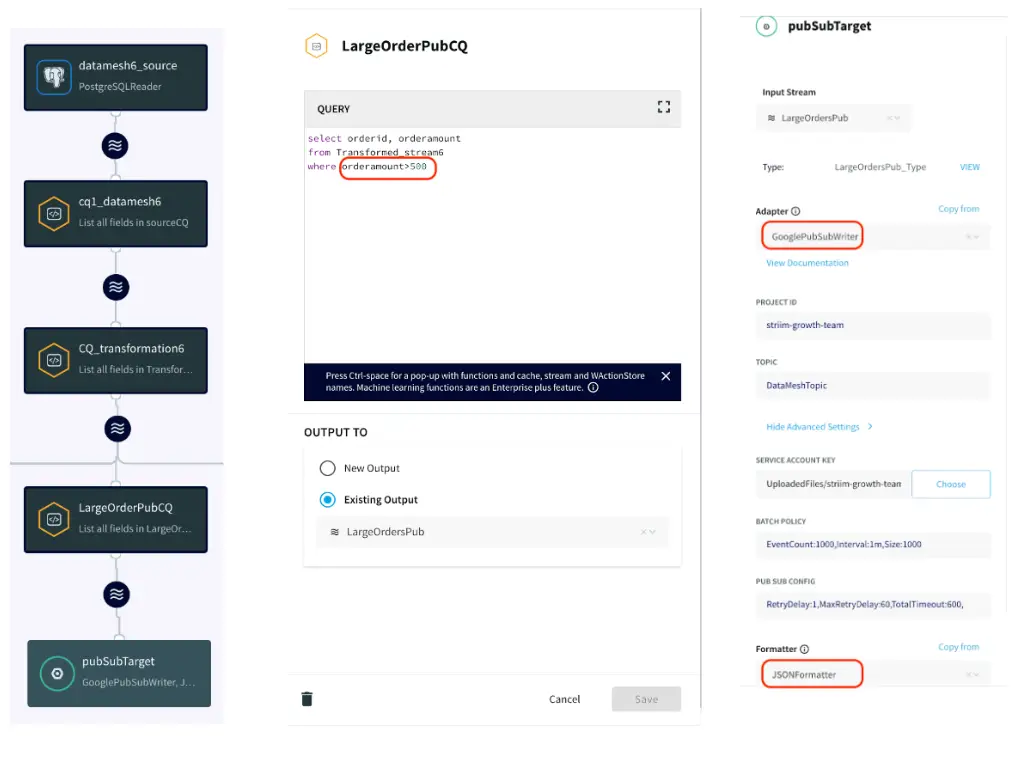
Emergency Room Monitor
The data containing Timestamp, hourOfDay, patientID, hospitalId, stage, symptoms, visitDuration, stageDuration, roomId, providerId, diagnosisCode, hospitalName, hospitalLat, hospitalLon, patientAge, patientlat, patientlon, roomName, roomType, providerLastName, providerType and diagnosis is passed through a 30 min window based on timestamp column and following analytics are performed:
- DiagnosisAnalytics
- HandleAlerts
- HospitalAnalytics
- OccupancyAnalytics
- PreviousVisitAnalytics
- VisitsAnalytics
- WaitTimeStatsAnalytics
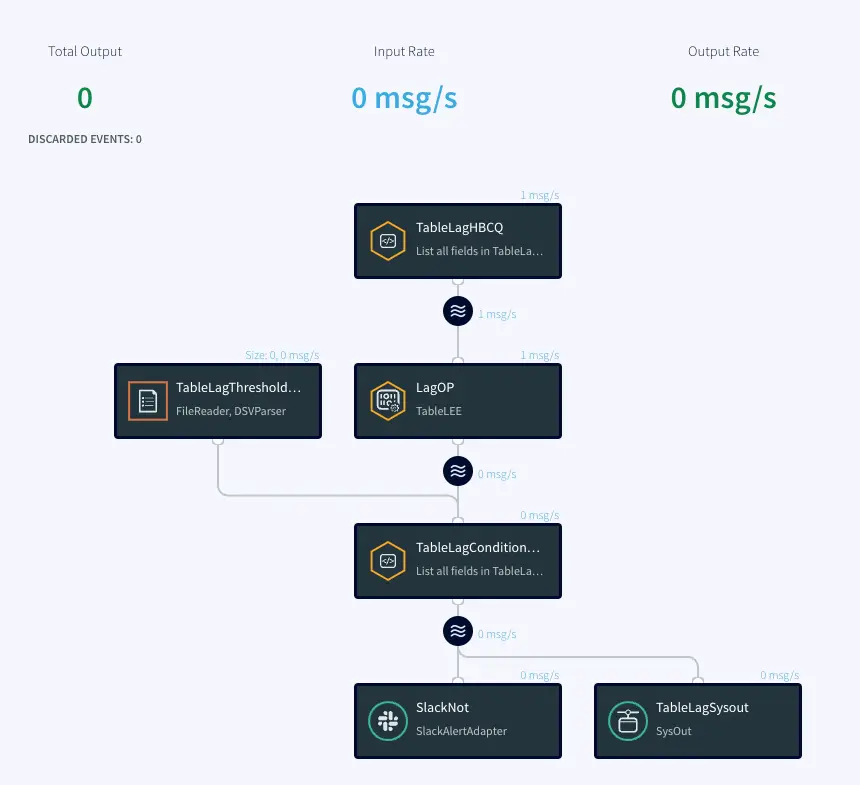
We will briefly look at each of the analyses in the following section. The TQL file contains every query and can be run directly to visualize the apps and dashboard.
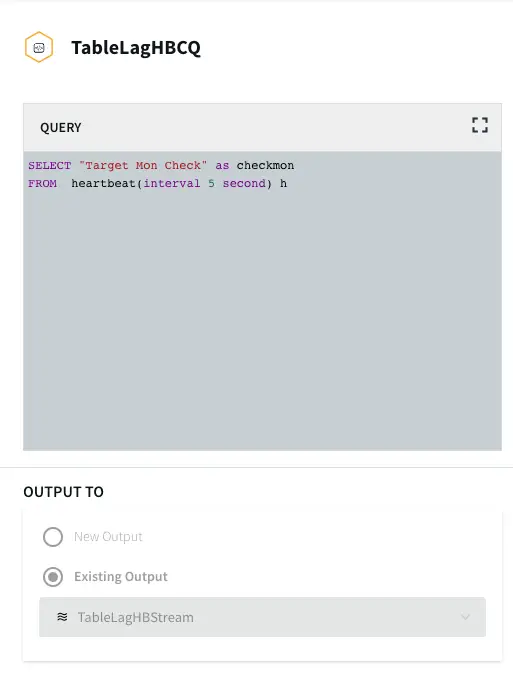
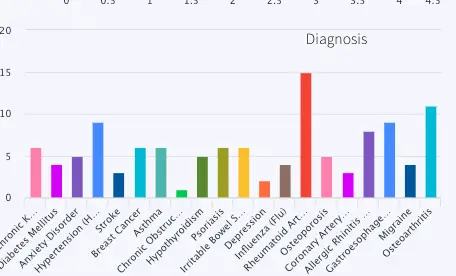
DiagnosisAnalytics: Number of patients for each type of diagnosis in the last 30 minutes is calculated. The data is visualized using a bar chart in the final dashboard. The name of the WAction store and Event table for the processed data are DiagnosisHistory and DiagnosisCountCurrent respectively. The query reading data for the bar chart is PreviousVisitsByDiagnosis.
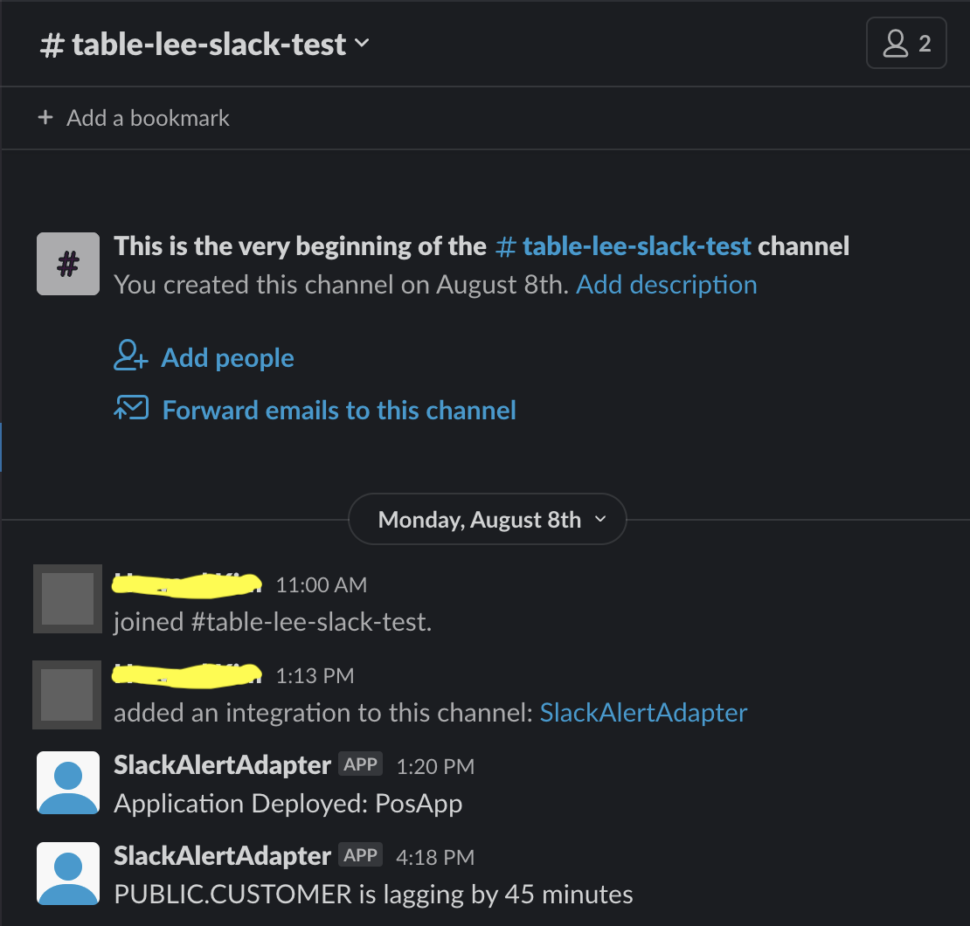
HandleAlerts: This analysis uses a Continuous Query to assign wait status as ‘normal’, ‘medium’ and ‘high’. It also generates alerts if the wait time does not improve in 30 minutes. The alert messages are:
Case 1: If wait time improves:
Hospital <hospital name> wait time of <last wait time> minutes is back to acceptable was <first wait time>
Case 2: If wait time worsens:
Hospital <hospital name> wait time of <last wait time> minutes is too high was <first wait time> with <number of patients> current visits
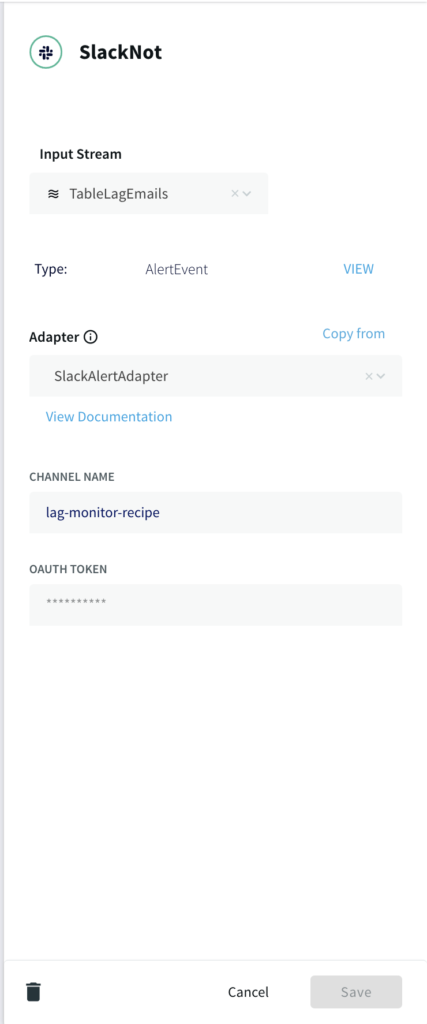
The alert is sent to a Alert Adapter component named SendHospitalWebAlerts
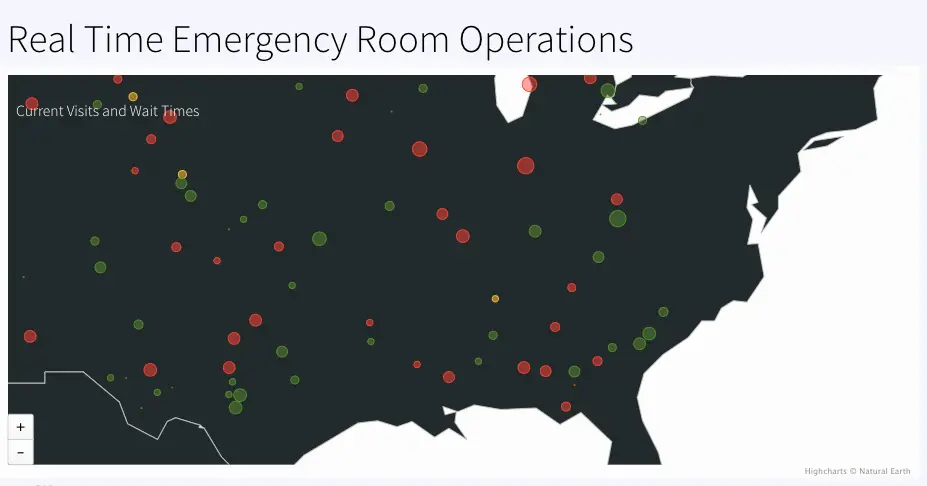
HospitalAnalytics: Calculates number of visits and waitstatus based on maximum wait-time in each hospital. The geographical information of each hospital is used to color code ‘normal’, ‘medium’ and ‘high’ wait status in the map. The event table and WAction Store where the outcoming data is stored are VisitsByHospitalCurrent and VisitsByHospitalHistory respectively.
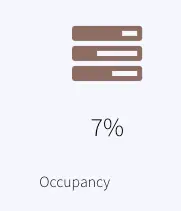
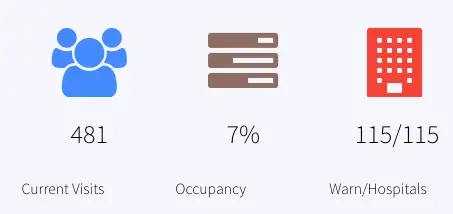
OccupancyAnalytics: Calculate the percentage of occupied rooms from a 30 mins window. The current data is stored in the event table, OccupancyCurrent. The percentage is reported as Occupancy in the dashboard.
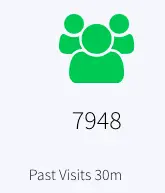
PreviousVisitAnalytics: Number of previous visits that are now Discharged, Admitted or have left in the past 30 mins are calculated. The resulting data is stored in the event table, PreviousVisitCountCurrent and WAction store PreviousVisitCountHistory. The dashboard reports ‘Past Visits 30m’ to show the previous visit count.
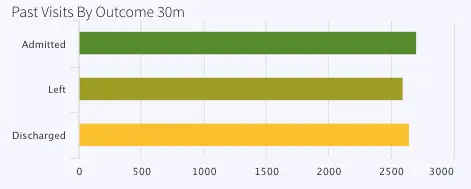
Another CQ queries the number of previous visits by stage (admitted, discharged or left) and stores current data inside event table, PreviousVisitsByStageCurrent and historical data inside WAction store, PreviousVisitsByStageHistory.
The bar chart titled ‘Past Visits By Outcome 30m’ represents this data.
VisitsAnalytics: Calculates the current visit number from the 30 min window and also the number of visits by stage.
The number of current visits is stored in the event table VisitCountCurrent and historical data is stored in the WAction store VisitCountHistory. In the dashboard the current count is reported under ‘Current Visits’
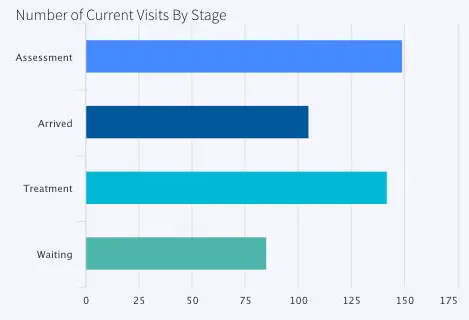
The number of visits by stage (Arrived, Waiting, Assessment or Treatment is also calculated and stored in VisitsByStageCurrent (event table) and VisitsByStageHistory (WAction Store). The data is labeled as ‘Number of Current Visits By Stage’ in the dashboard.
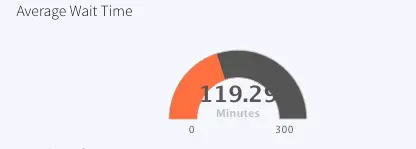
WaitTimeStatsAnalytics: For stage ‘waiting’, the minimum, maximum and average wait time is calculated and stored in WaitTimeStatsCurrent (Event Table) and WaitTimeStatsHistory (WAction Store).
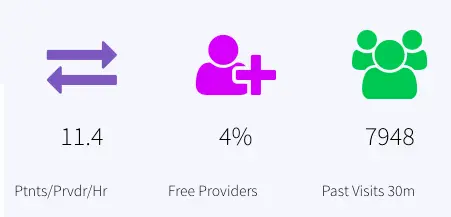
All data from the 30 min window is saved in the event table CurrentVisitStatus. Provider analytics is done by querying this event table and joining with cache, ‘Providers’. The data is reported in the dashboard as ‘Ptnts/Prvdr/Hr’ and ‘Free Providers’
Wait Time Monitor
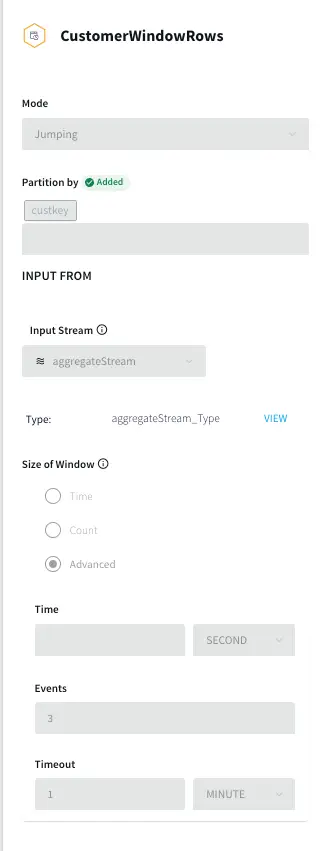
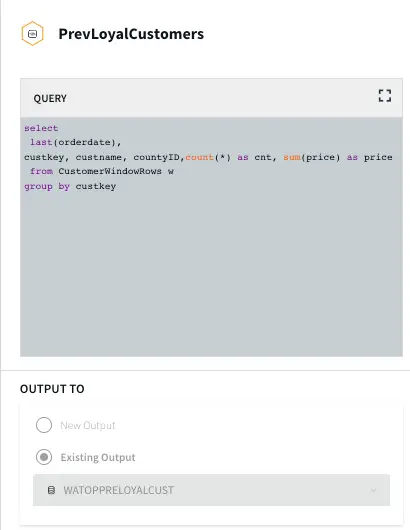
A jumping window streams one event at a time partitioned by patient ID and Hospital ID. The number of patients ahead of each event is calculated.
Based on the number of patients ahead, a customized message with estimated wait time information is generated
Eg: “<Patient name>, you are <1st/2nd/3rd or nth> in line at <hospital name> with an estimated <duration> wait time
The patient messages are stored in WACtion store PatientWaitMessages
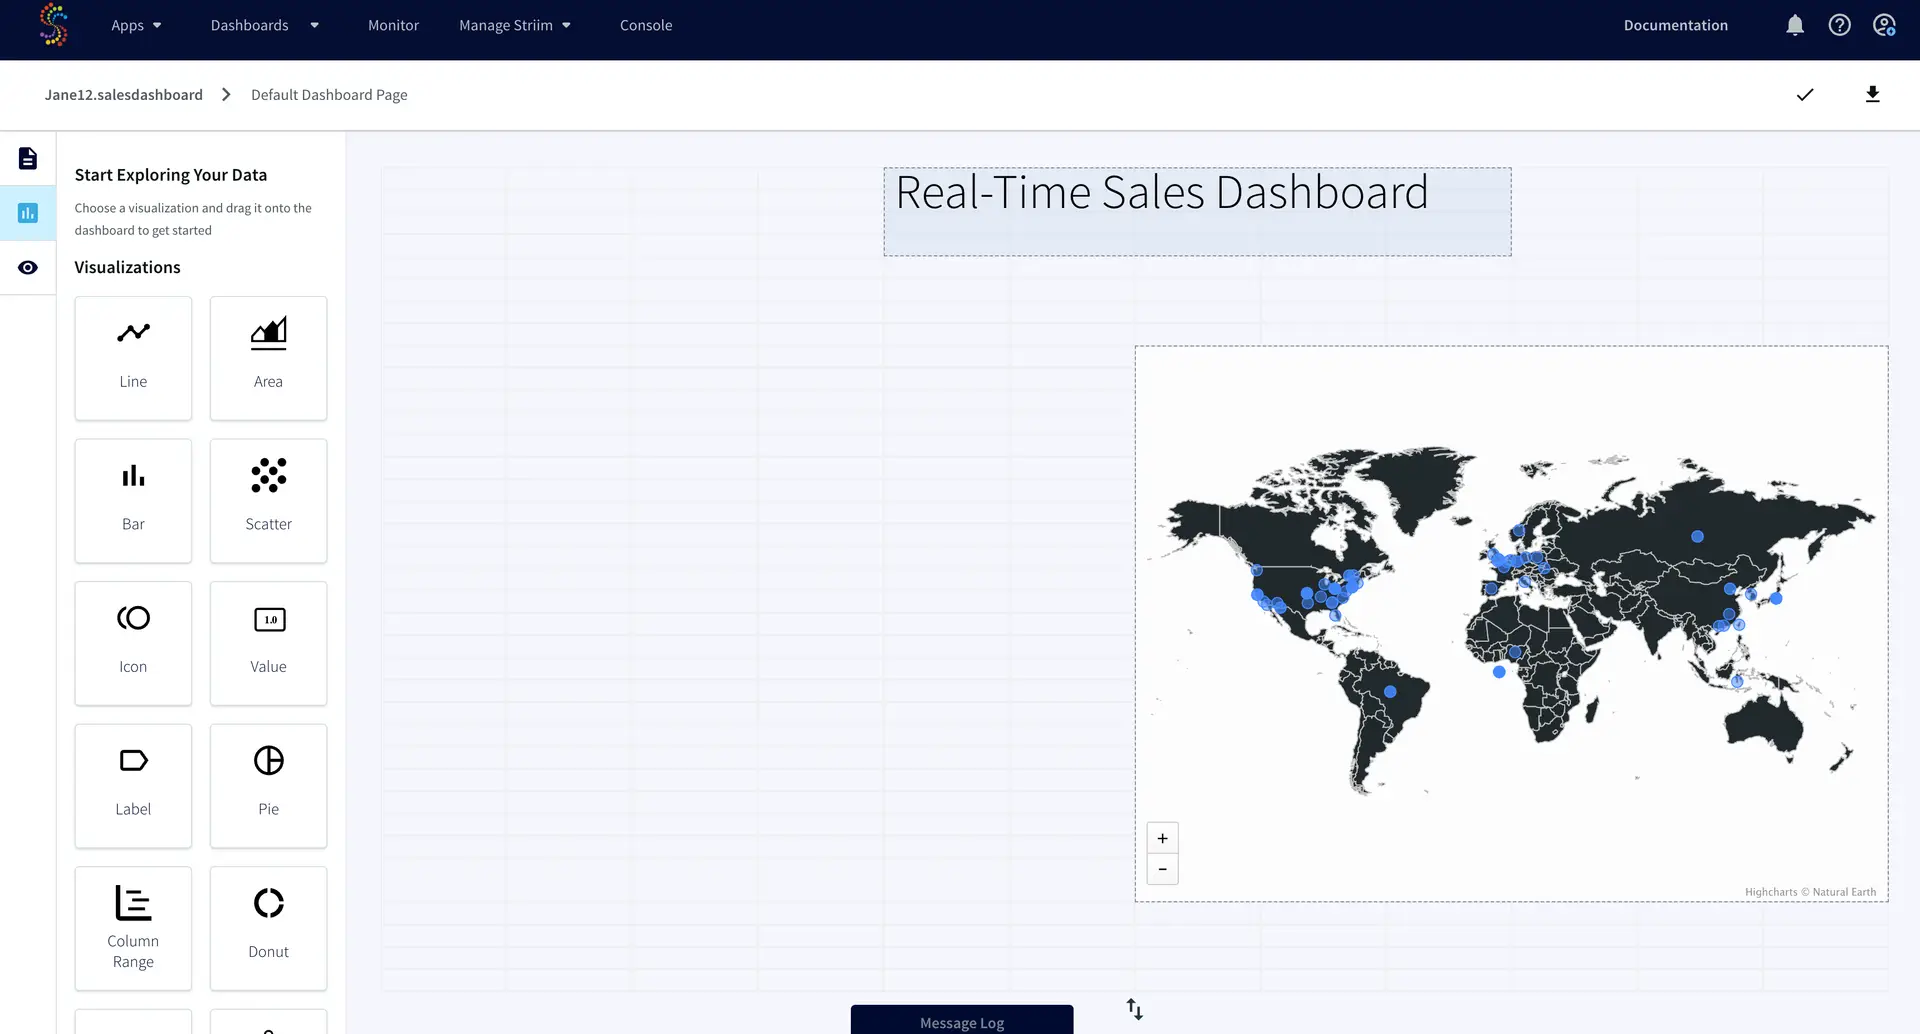
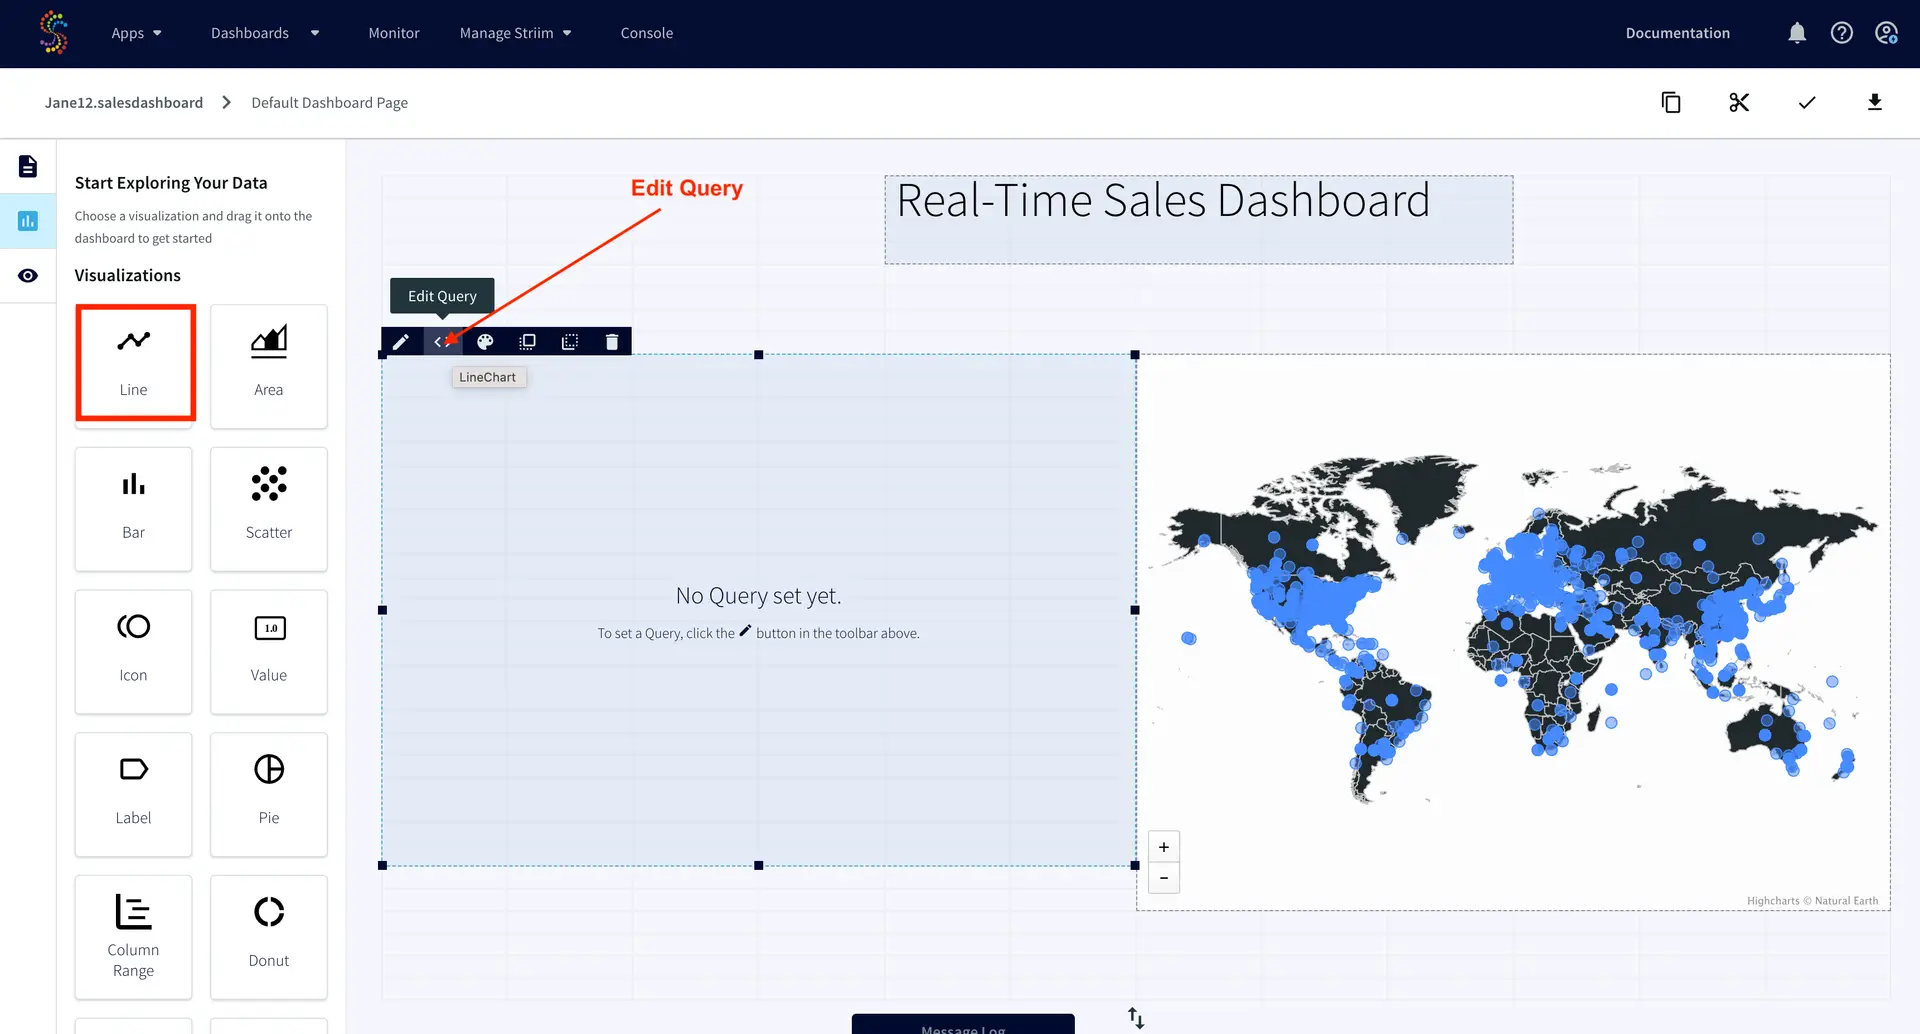
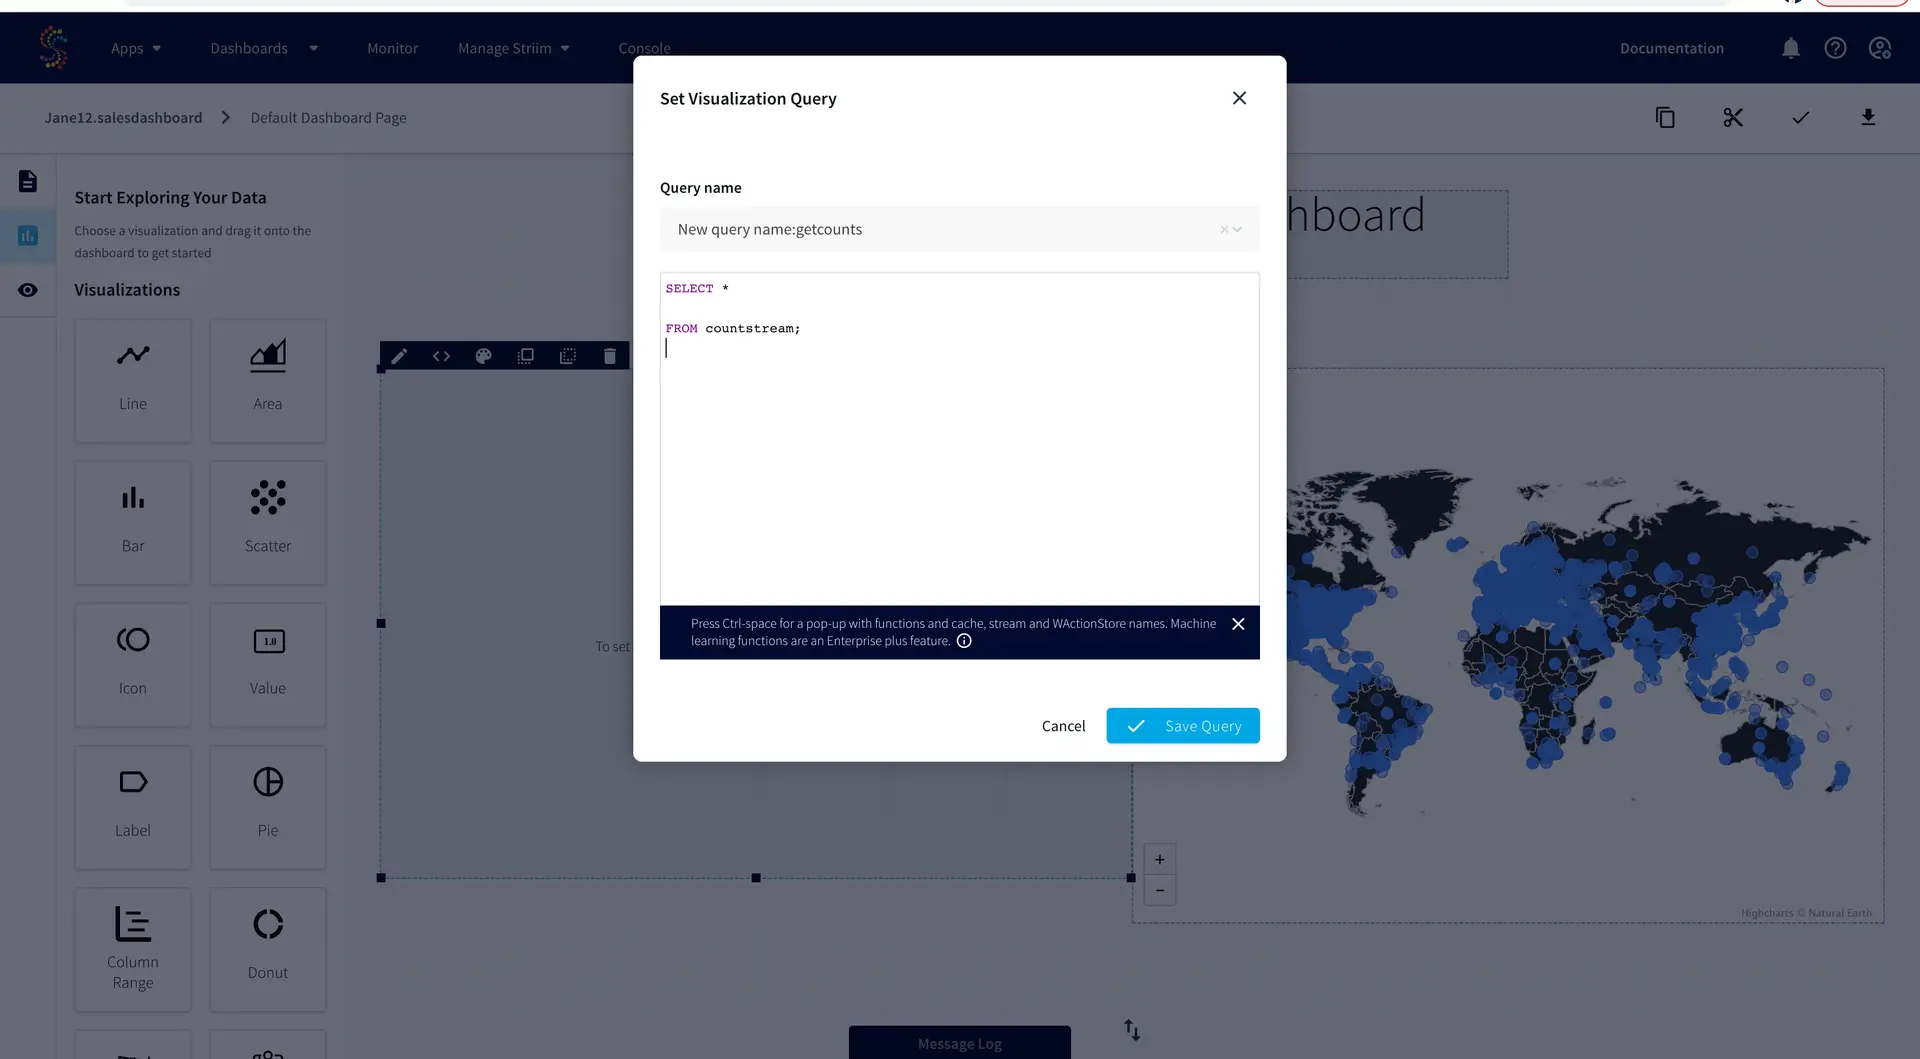
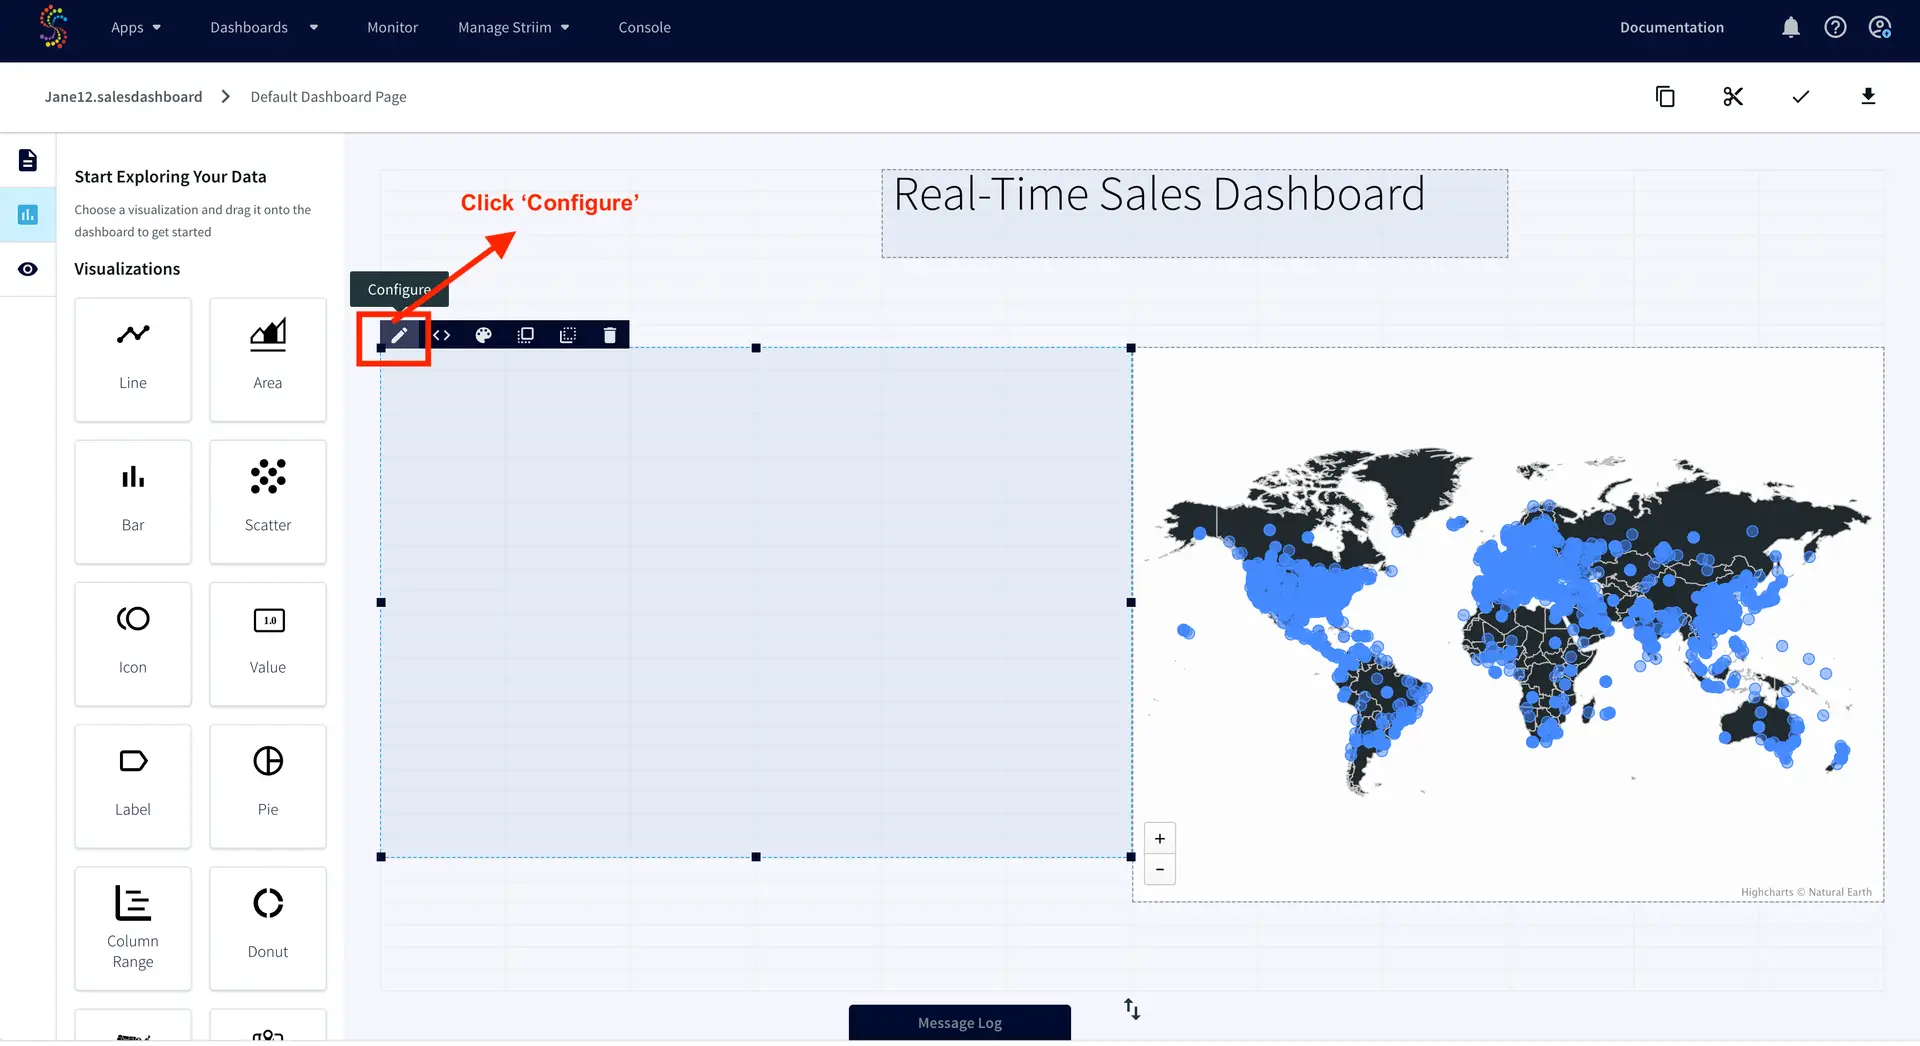
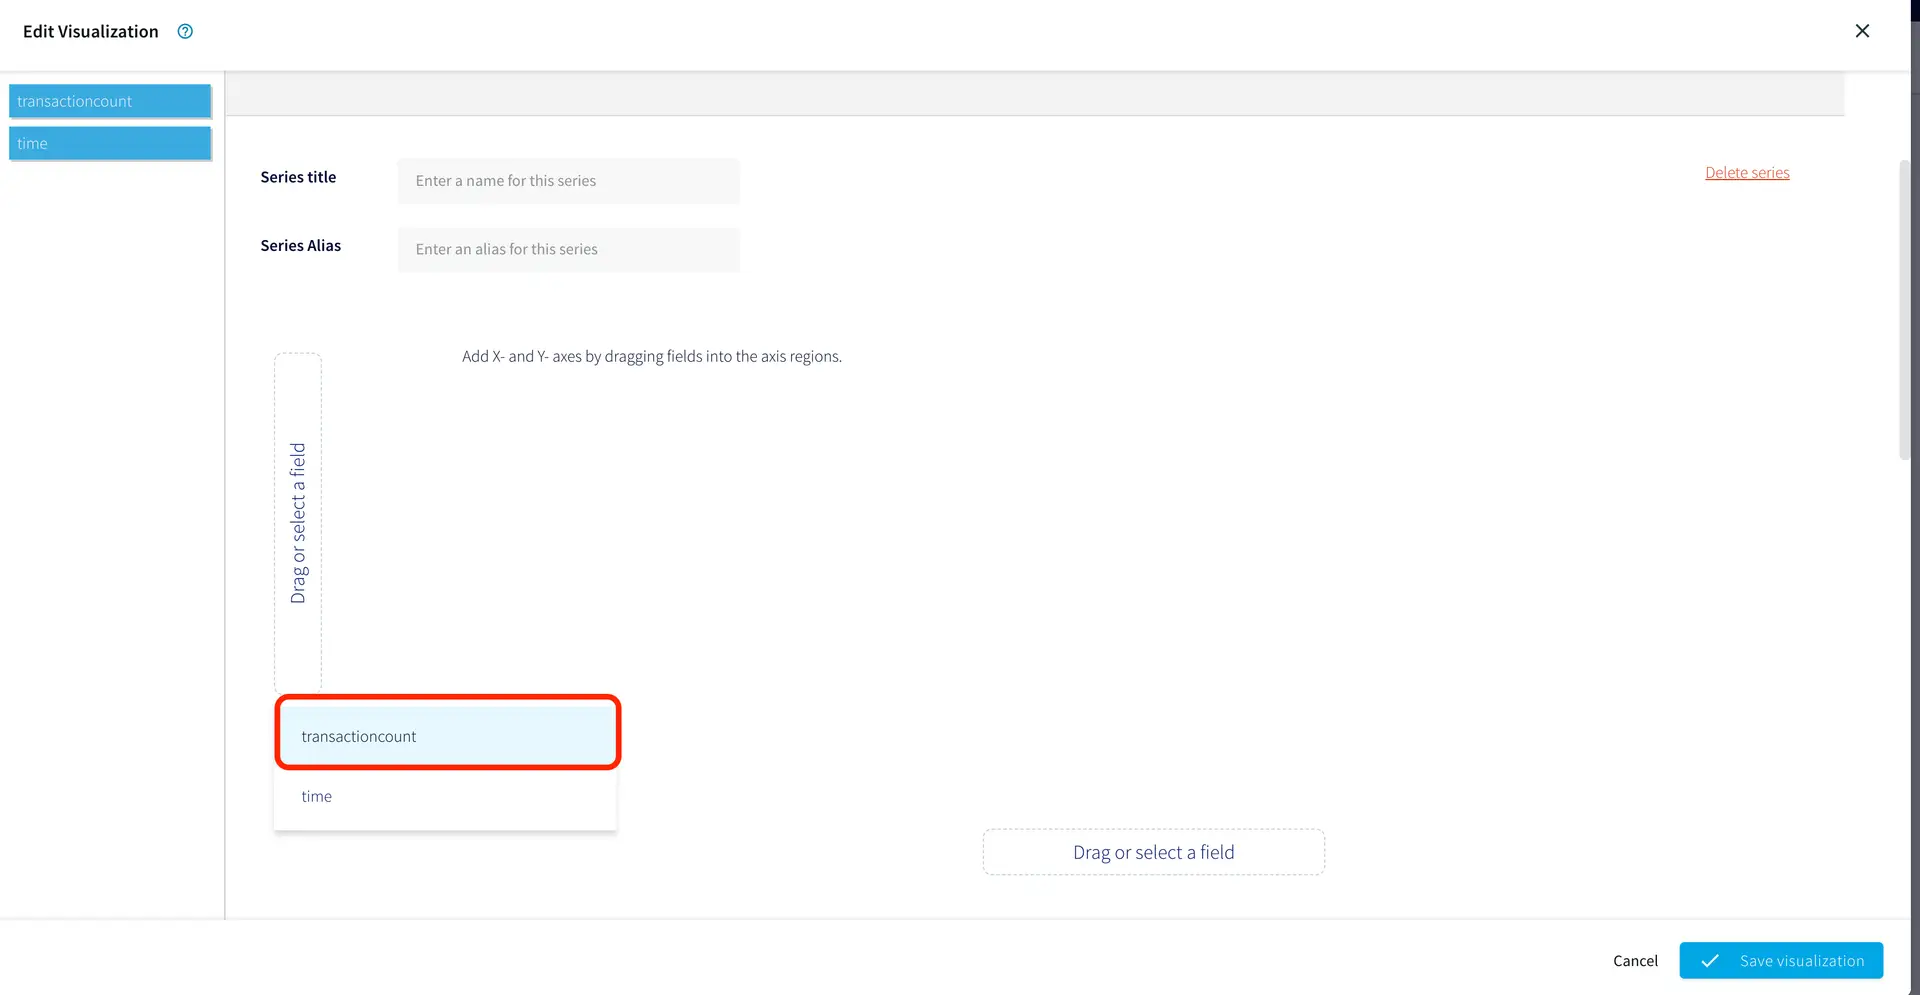
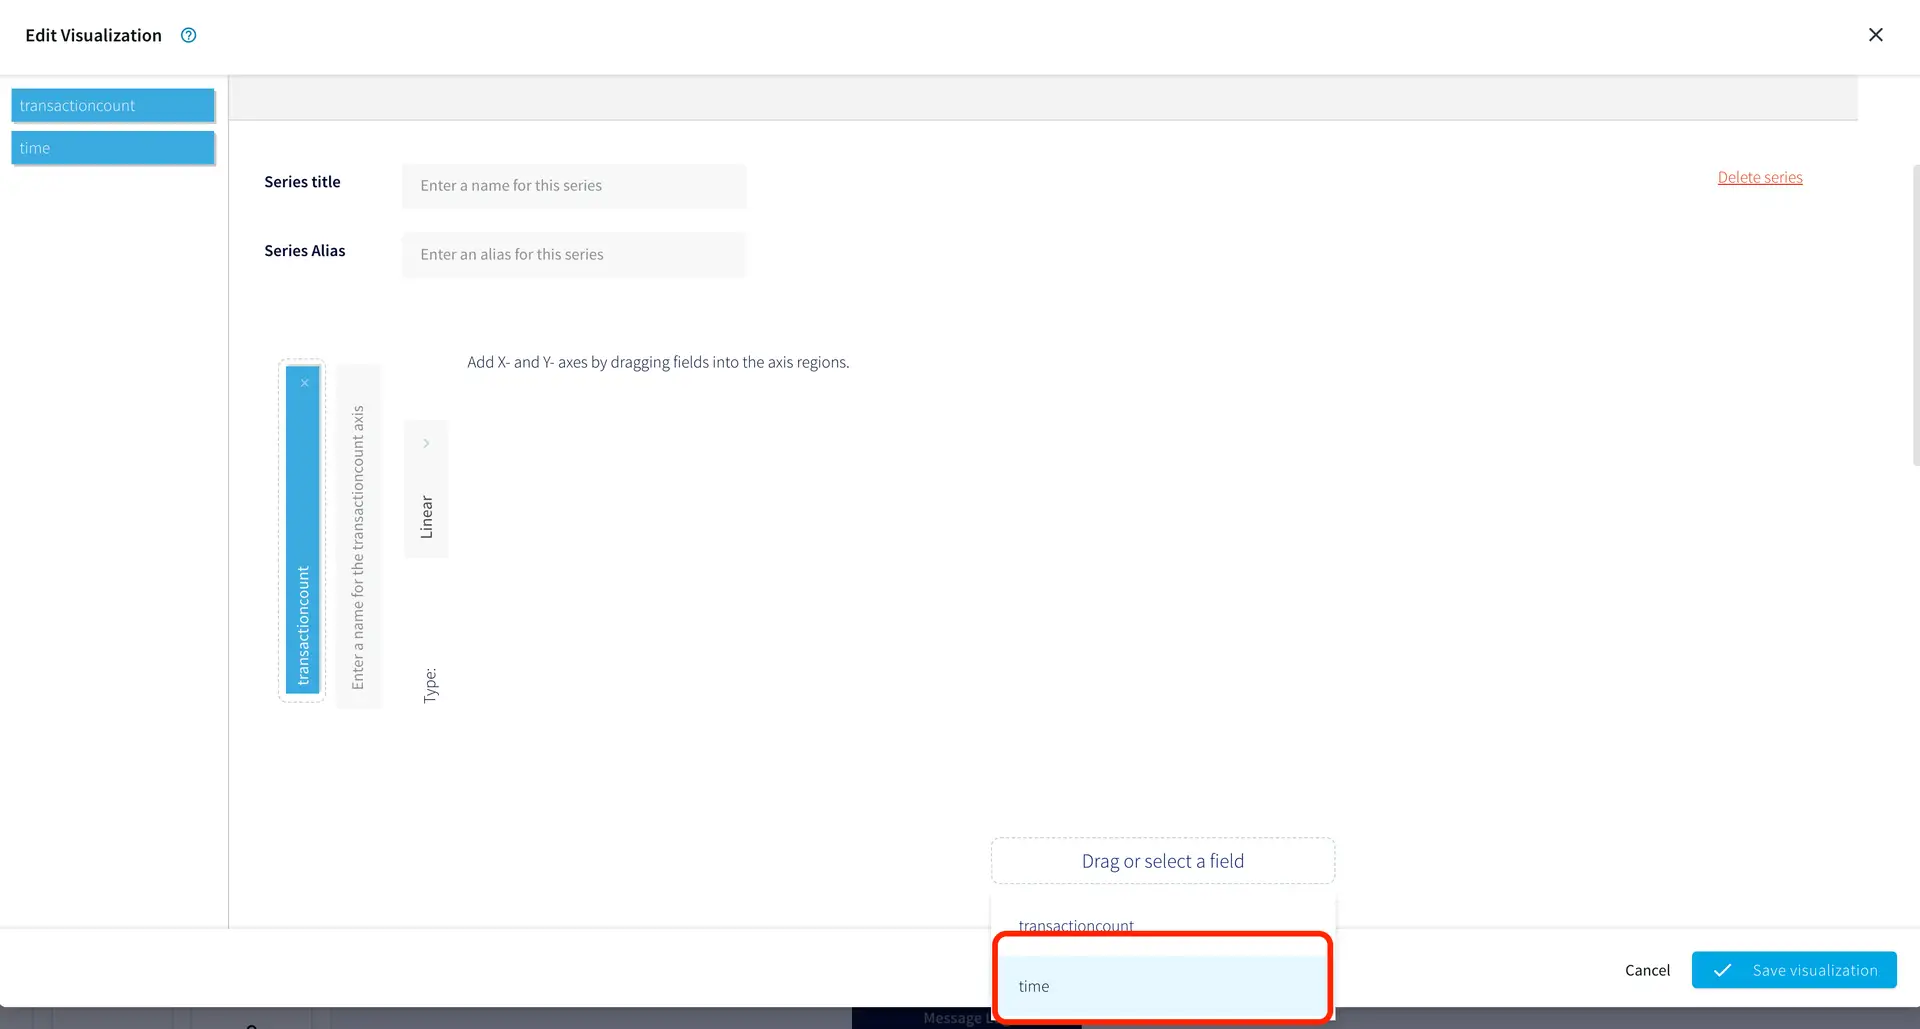
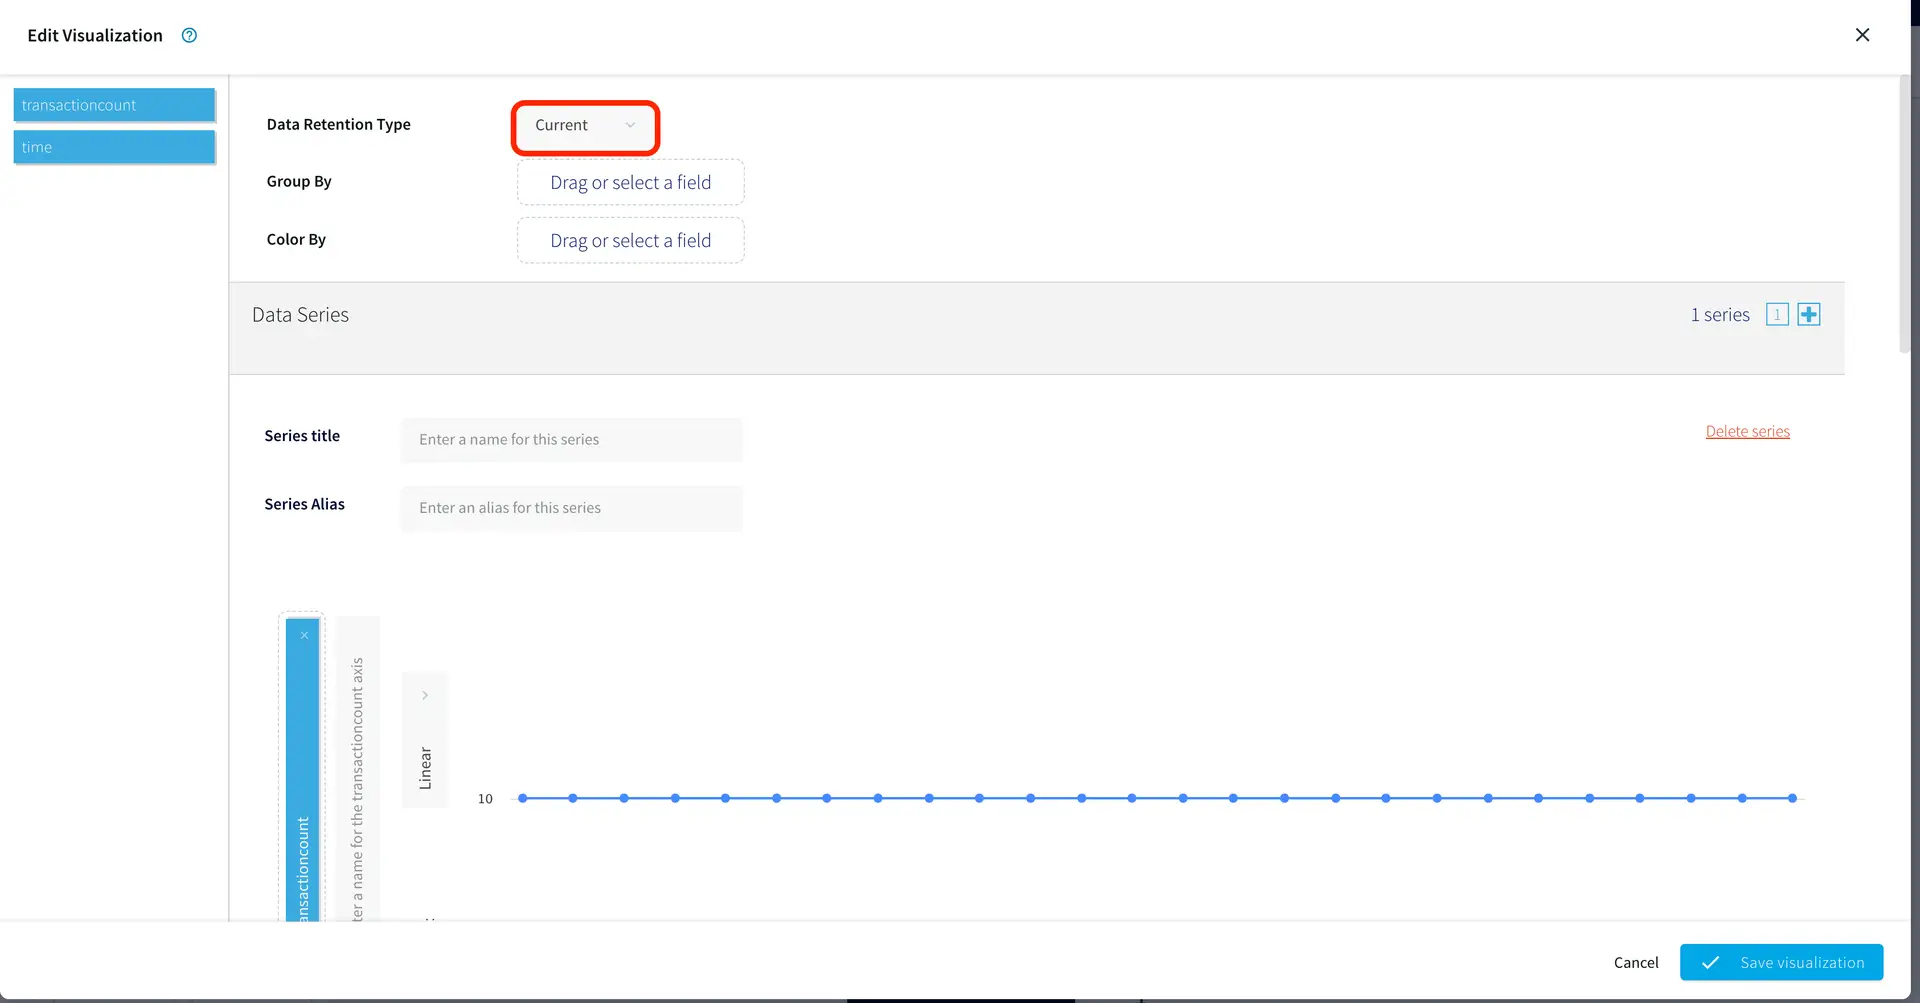
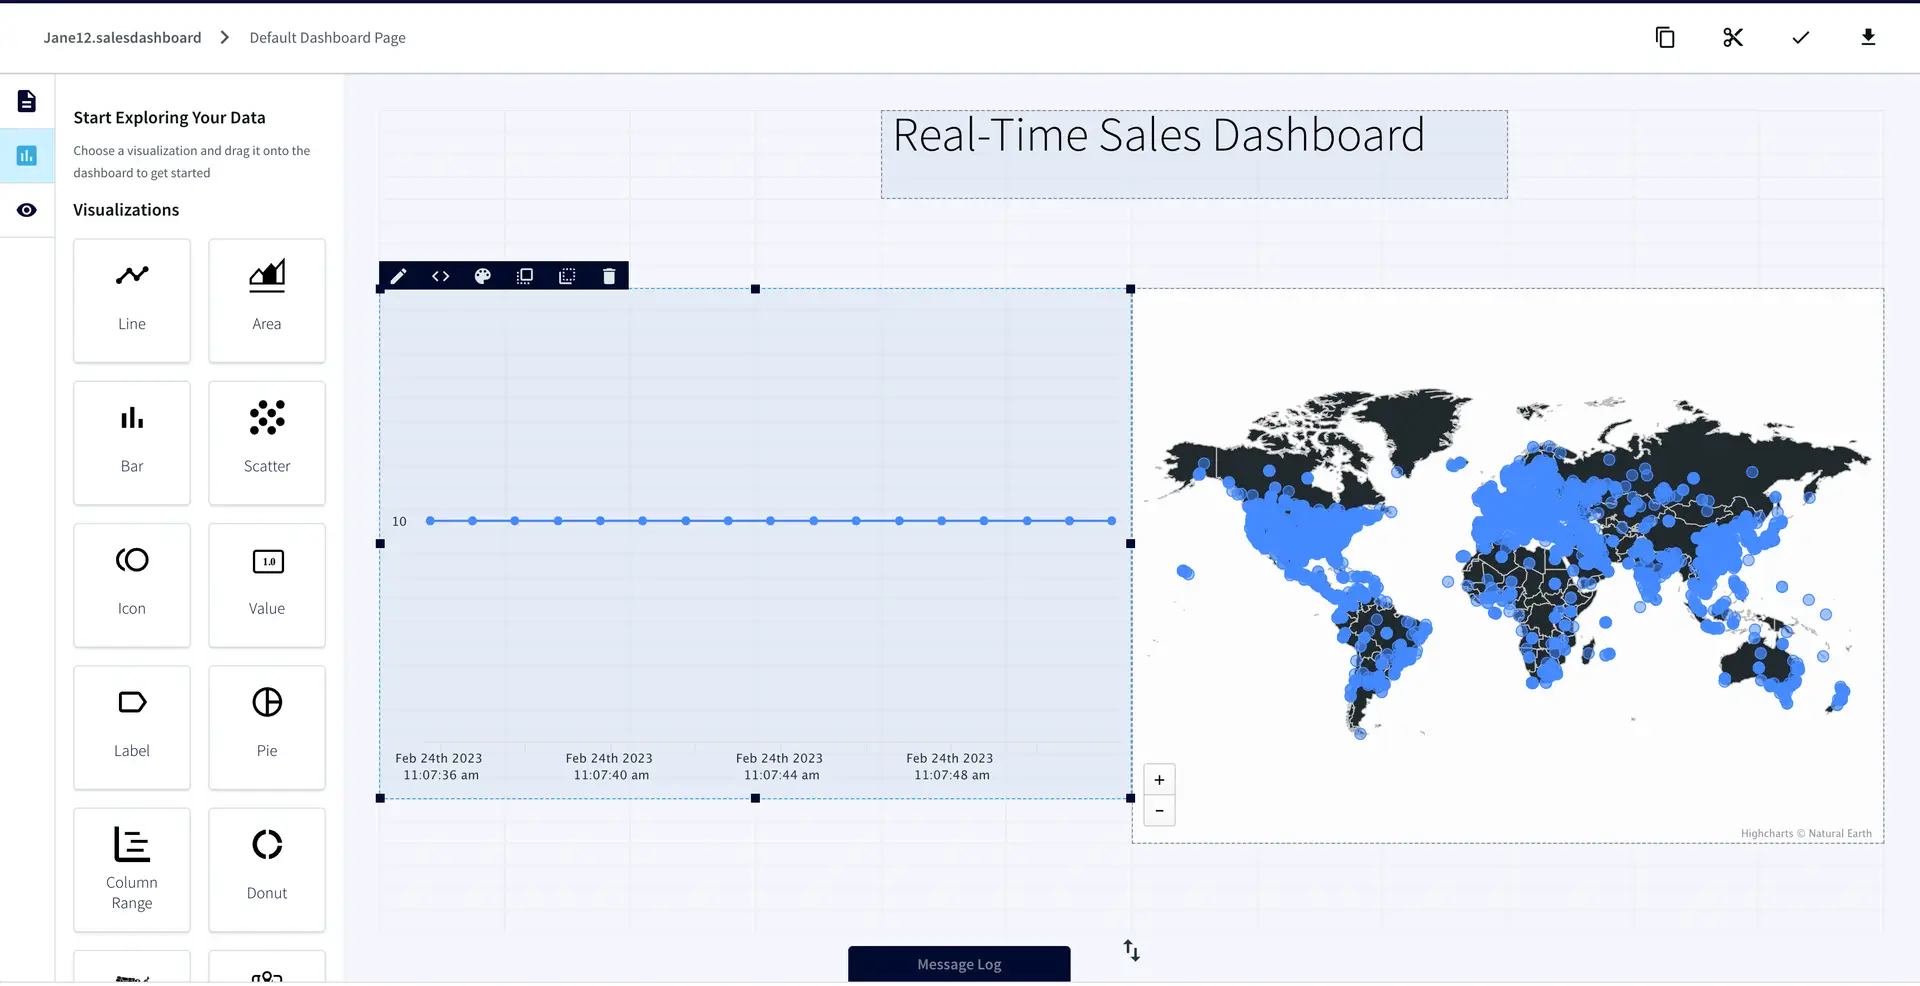
Dashboards
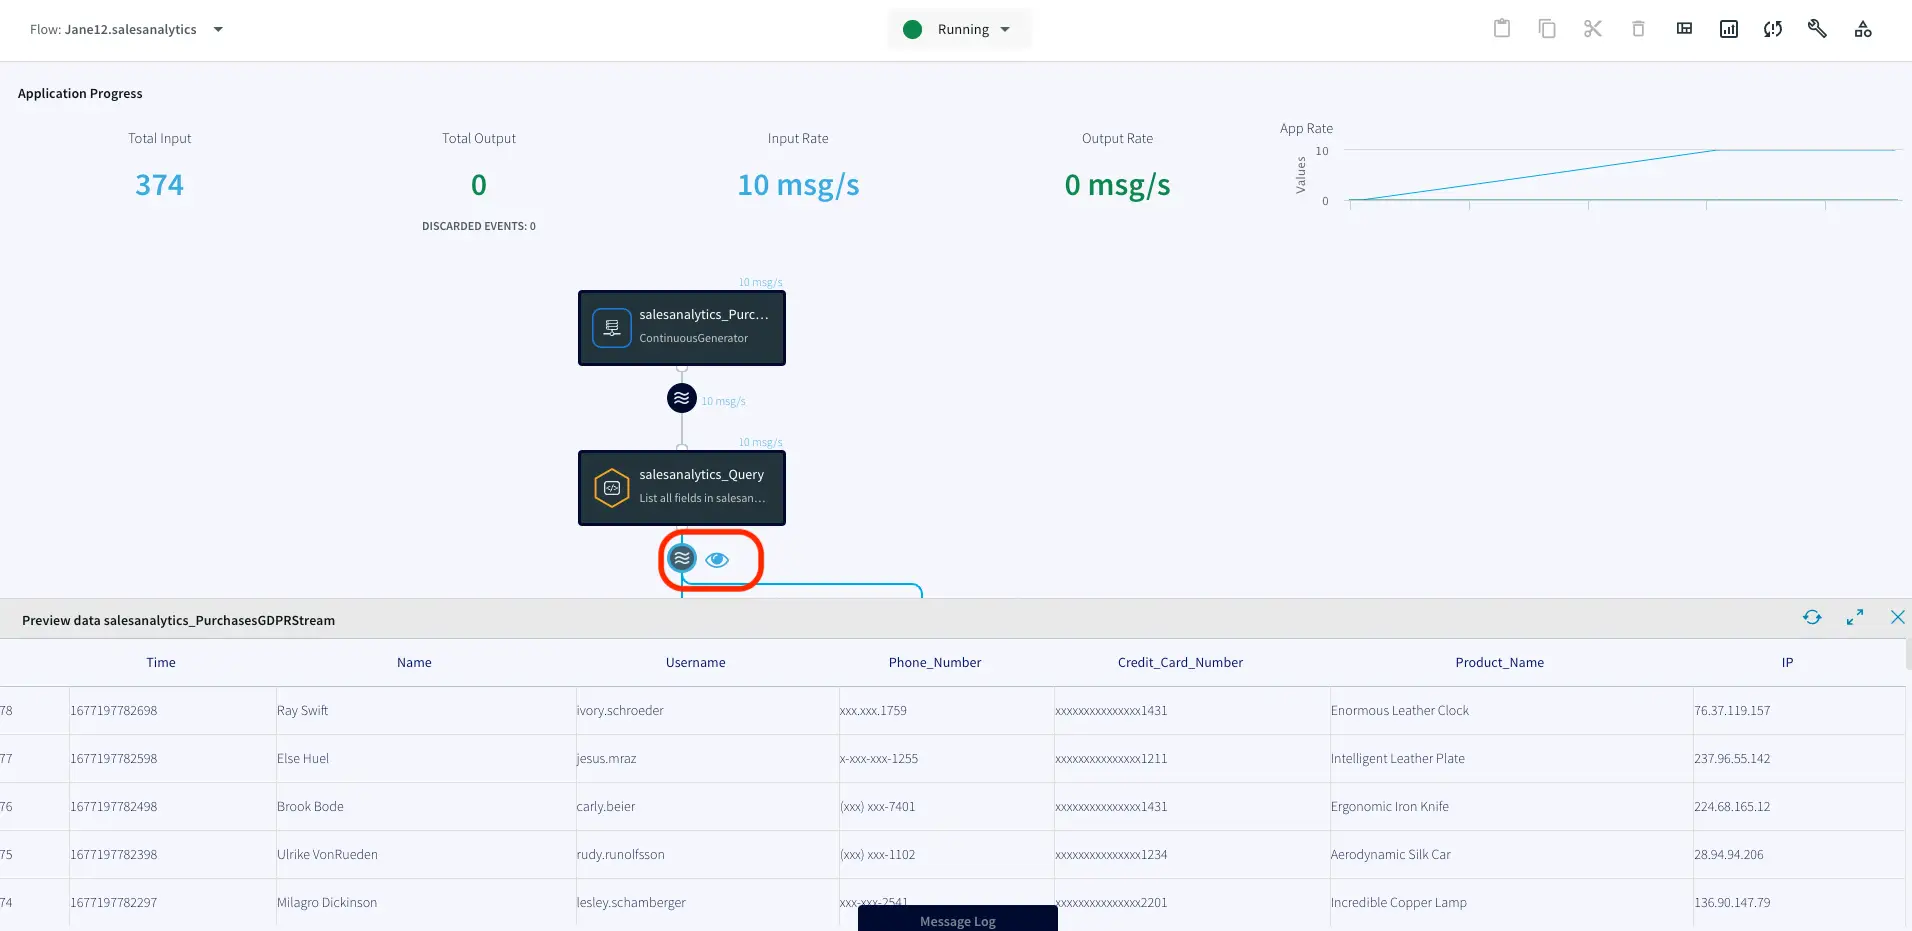
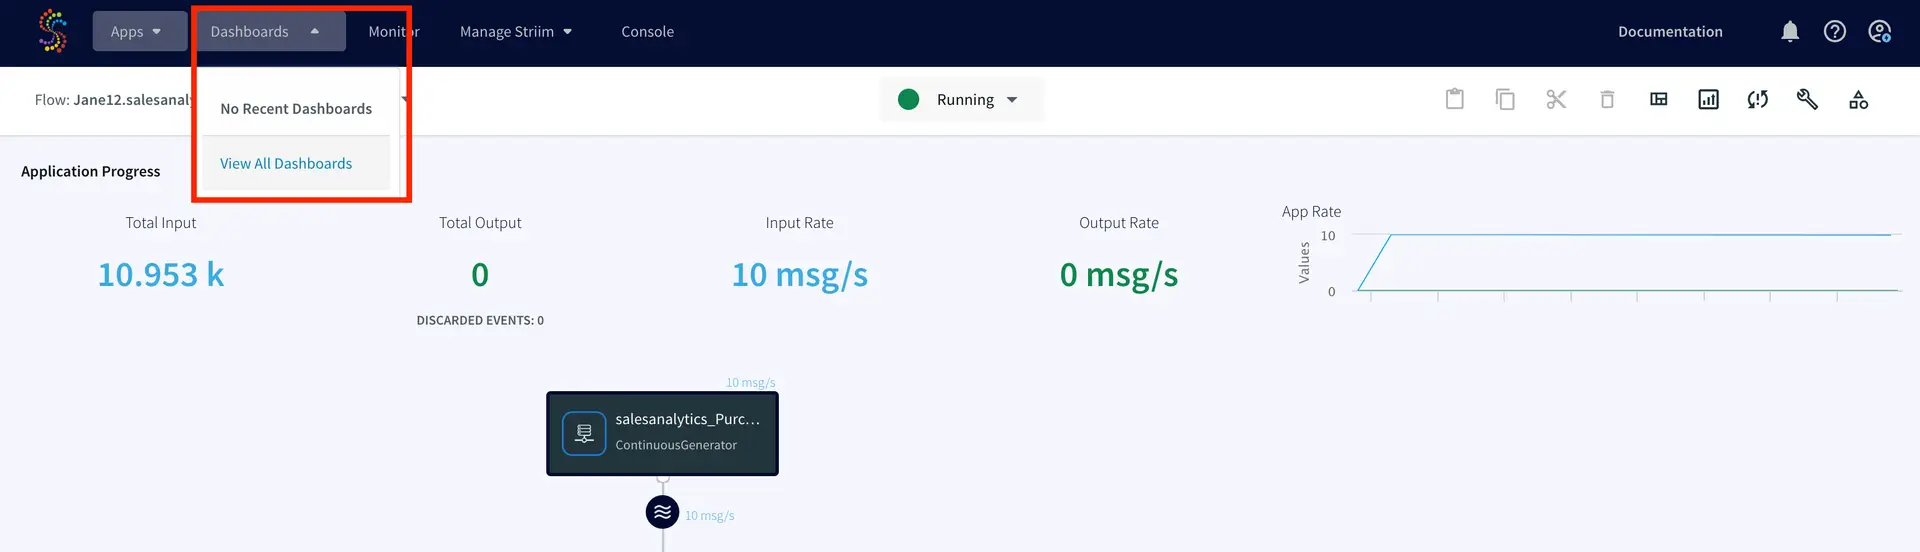
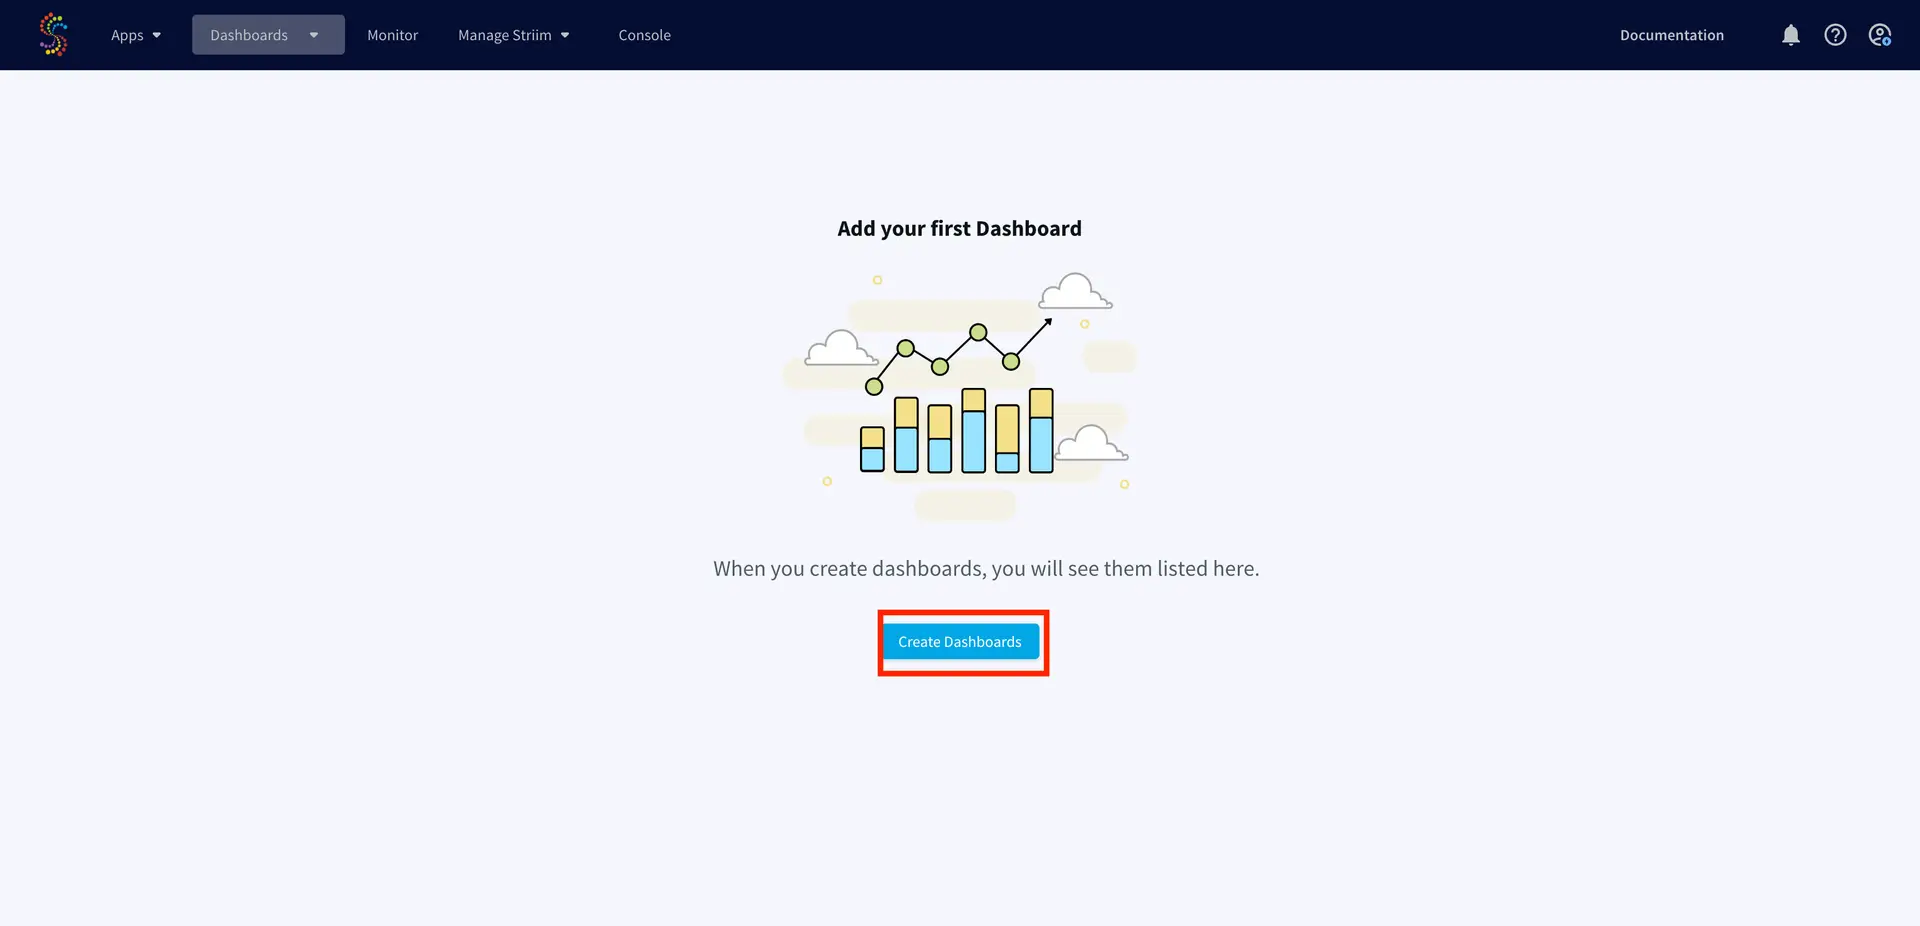
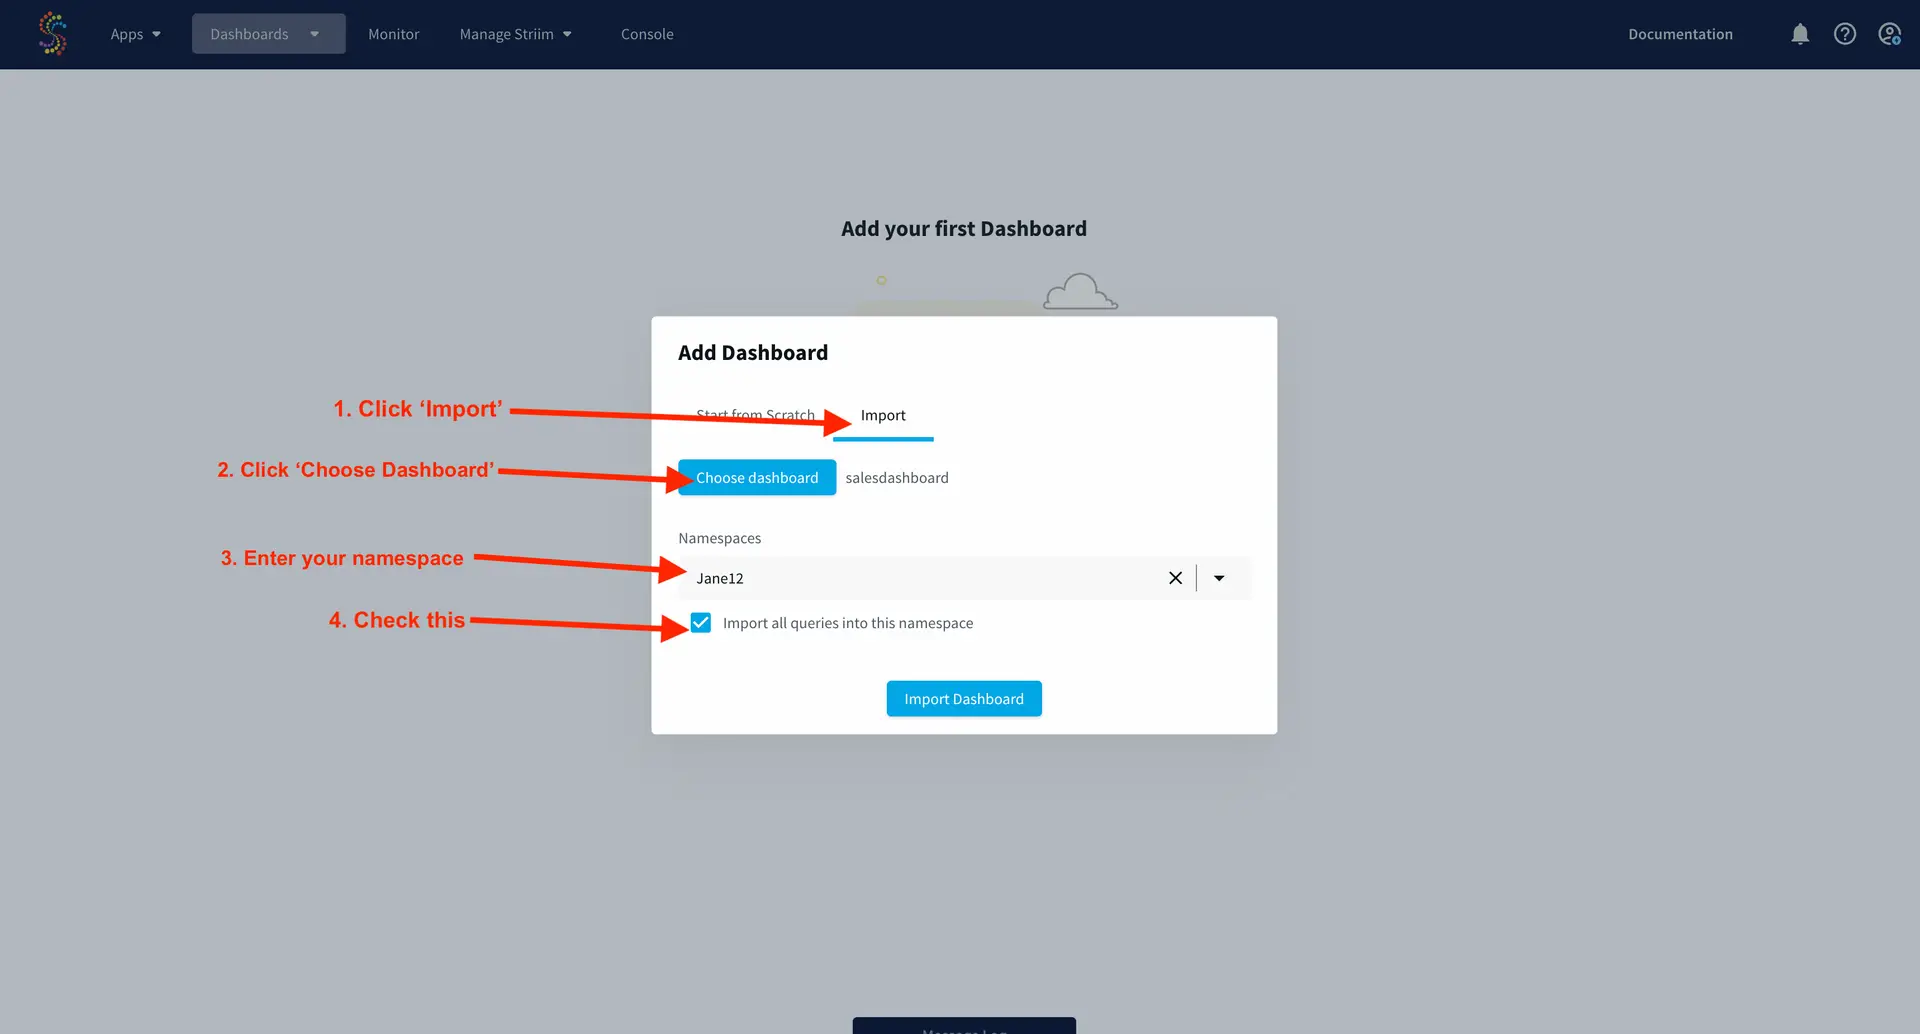
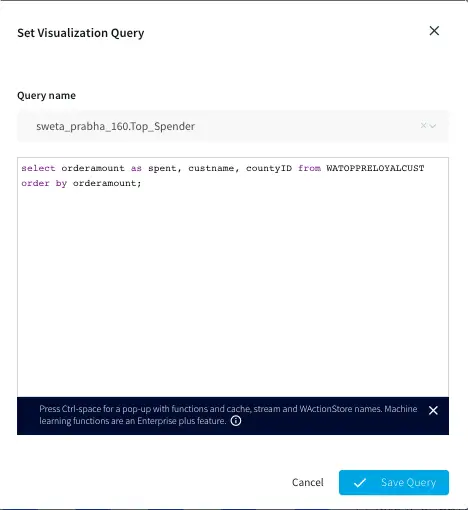
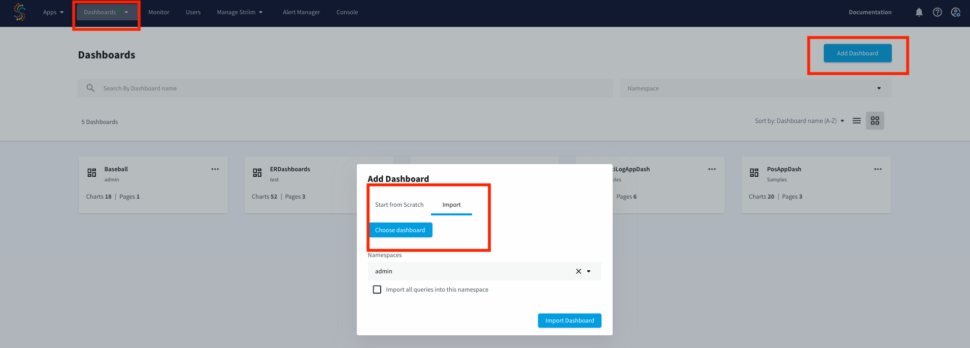
Striim offers UI dashboards that can be used for reporting. The dashboard JSON file provided in our repo can be imported for visualization of ER monitor data in this tutorial. Import the raw JSON file from your computer, as shown below:
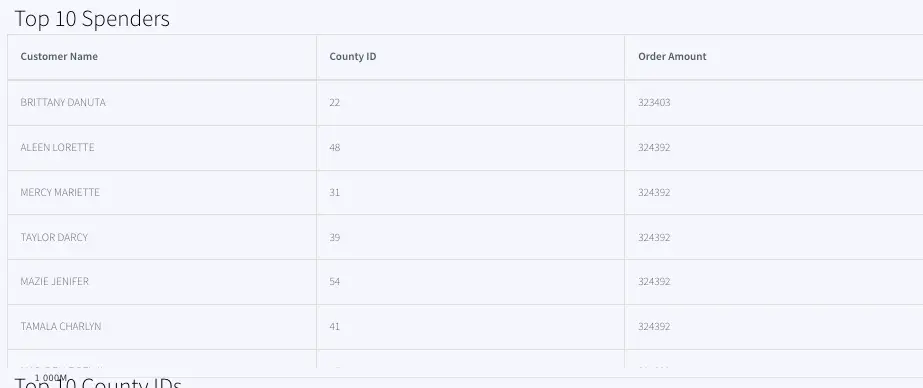
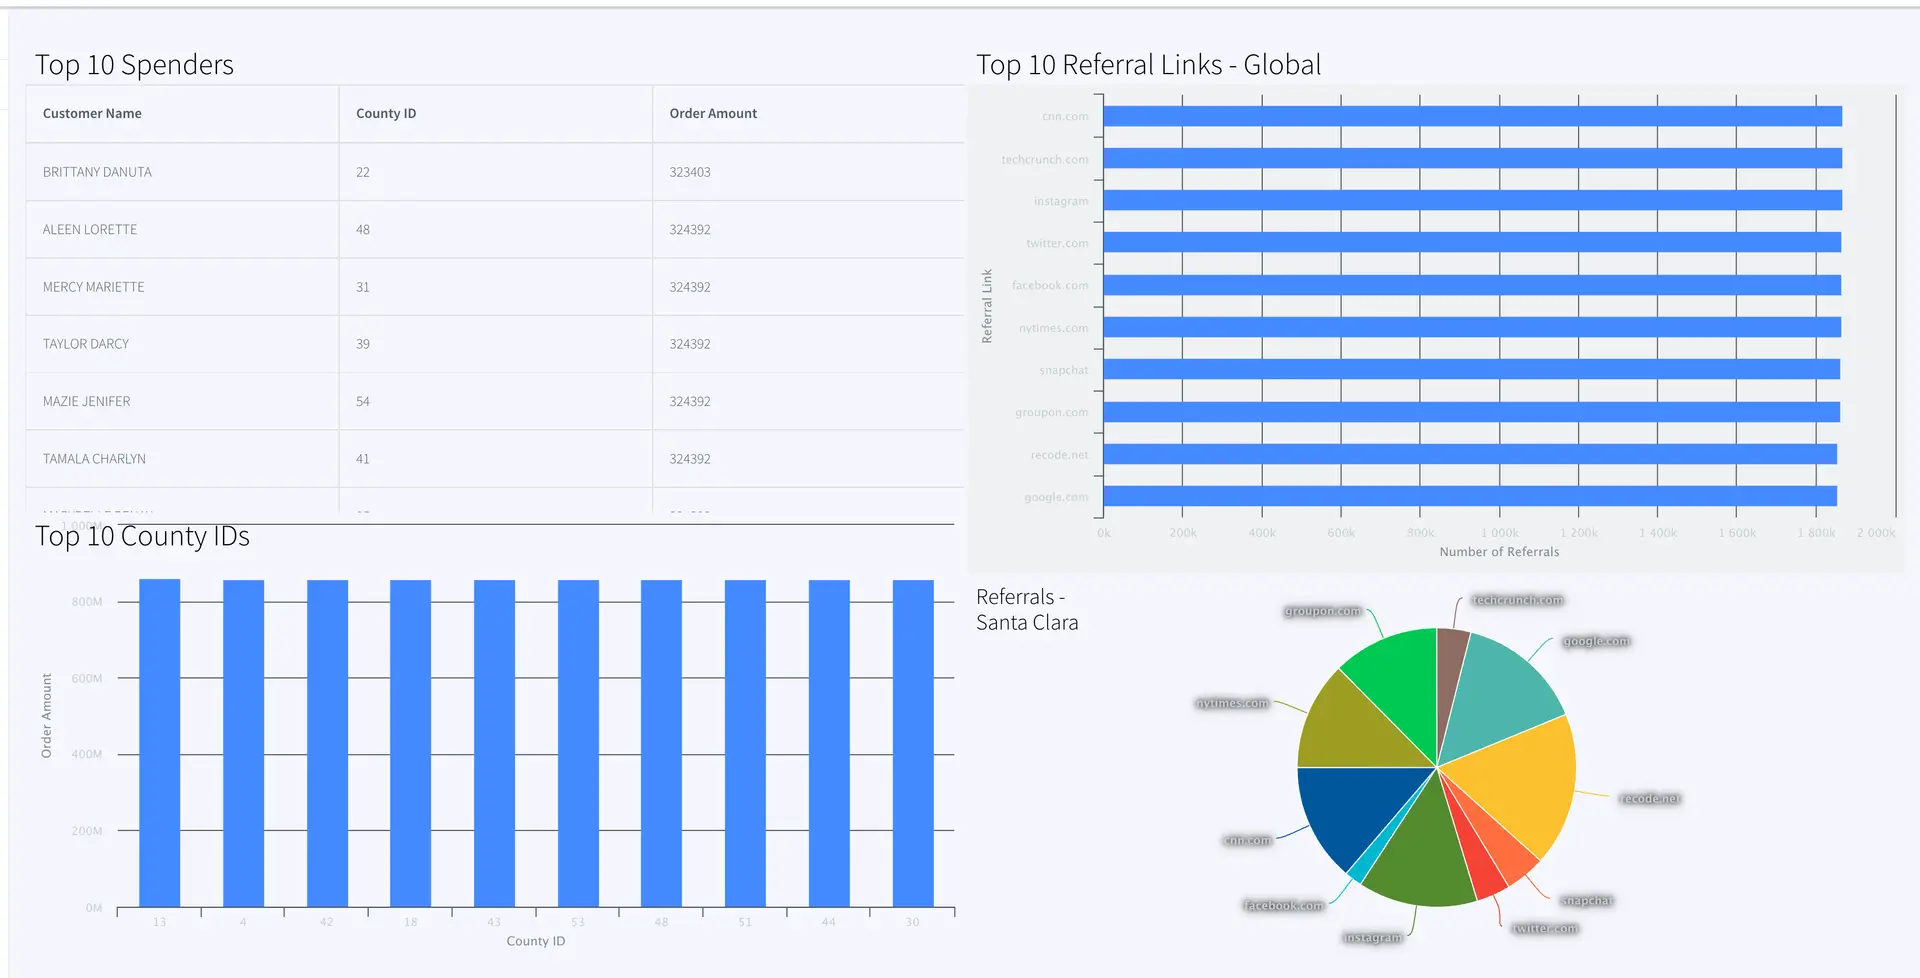
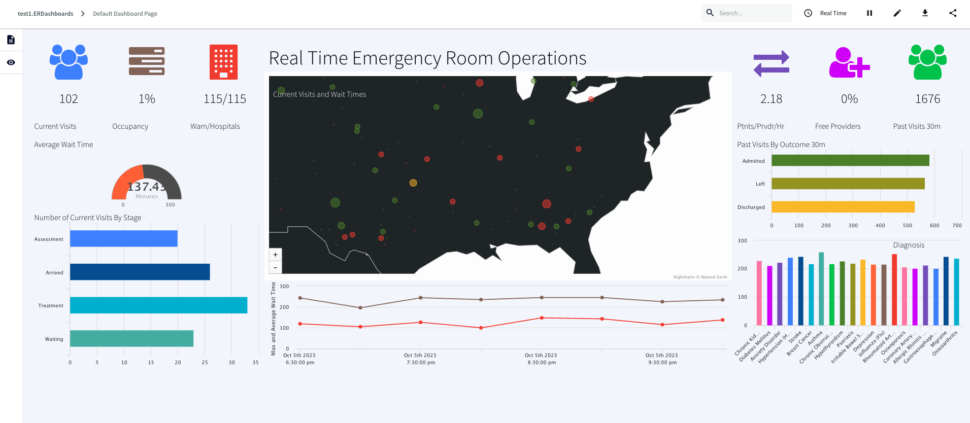
Here is a consolidated list of charts from the ER monitoring dashboard:
ActiveVisits: Number of patients that are in any other stage but “Arrived”, “Waiting”, “Assessment” or “Treatment” every 30 mins labeled as Current Visits Queries on: VisitCountCurrent
RoomOccupancy:Percentage of rooms occupied in each 30 mins window labeled as Occupancy, Queries Event Table: OccupancyCurrent
HospitalsWithHighWaits: Number of hospital with max wait status > 45 minutes/number of hospitals with wait, labeled as Warn/Hospitals, Queries event table: CurrentVisitStatus
ActiveVisitWaitTime: Average wait time of all hospitals, labeled as Average Wait Time , Queries event table: WaitTimeStatsCurrent
VisitsByStage: Number of Visits for Assessment, Arrived, Treatment and Waiting at each timestamp, labeled as Number of Current Visits By Stage, Queries event table: VisitsByStageCurrent
GetCurrentVisitsPerHospital: Number of visits every hospital (not ‘Discharged’, ‘Admitted’, ‘Left’) every 30 mins, labeled as, Real Time Emergency Room Operations , Queries event table: VisitsByHospitalCurrent
VisitDurationOverTime: Maximum wait time every 2 hours, labeled as Maximum Wait Time, Queries event table: WaitTimeStatsHistory
PatientsPerProvider: Patients/provider/hr, labeled as Ptnts/Prvdr/Hr, Queries event table: CurrentVisitStatus
FreeProvider: Total provider(queries: Cache Providers)- provider that are busy (queries: CurrentVisitStatus), calculate percent, labeled as Free Providers
PreviousVisits: Count of Discharged, Admitted, Left from 30 mins window, labeled Past Visits 30m, Queries event table: PreviousVisitCountCurrent
PreviousVisitsByOutcome: Number of Admitted, Left or Discharged in past 30 mins, labeled: Past Visits By Outcome 30m , Queries event table: PreviousVisitsByStageCurrent
PreviousVisitsByDiagnosis: Number of Diagnosis for each disorder in past 30 mins, labeled: Diagnosis, Queries event table: DiagnosisCountCurrent
Conclusion: Reimagine Healthcare Monitoring Leveraging Real-Time Data and Dashboards with Striim
In this tutorial, you have seen and created an Emergency Room (ER) monitoring analytics dashboard powered by Striim. This use case can be leveraged in many other scenarios in healthcare, such as pharmacy order monitoring and distribution.
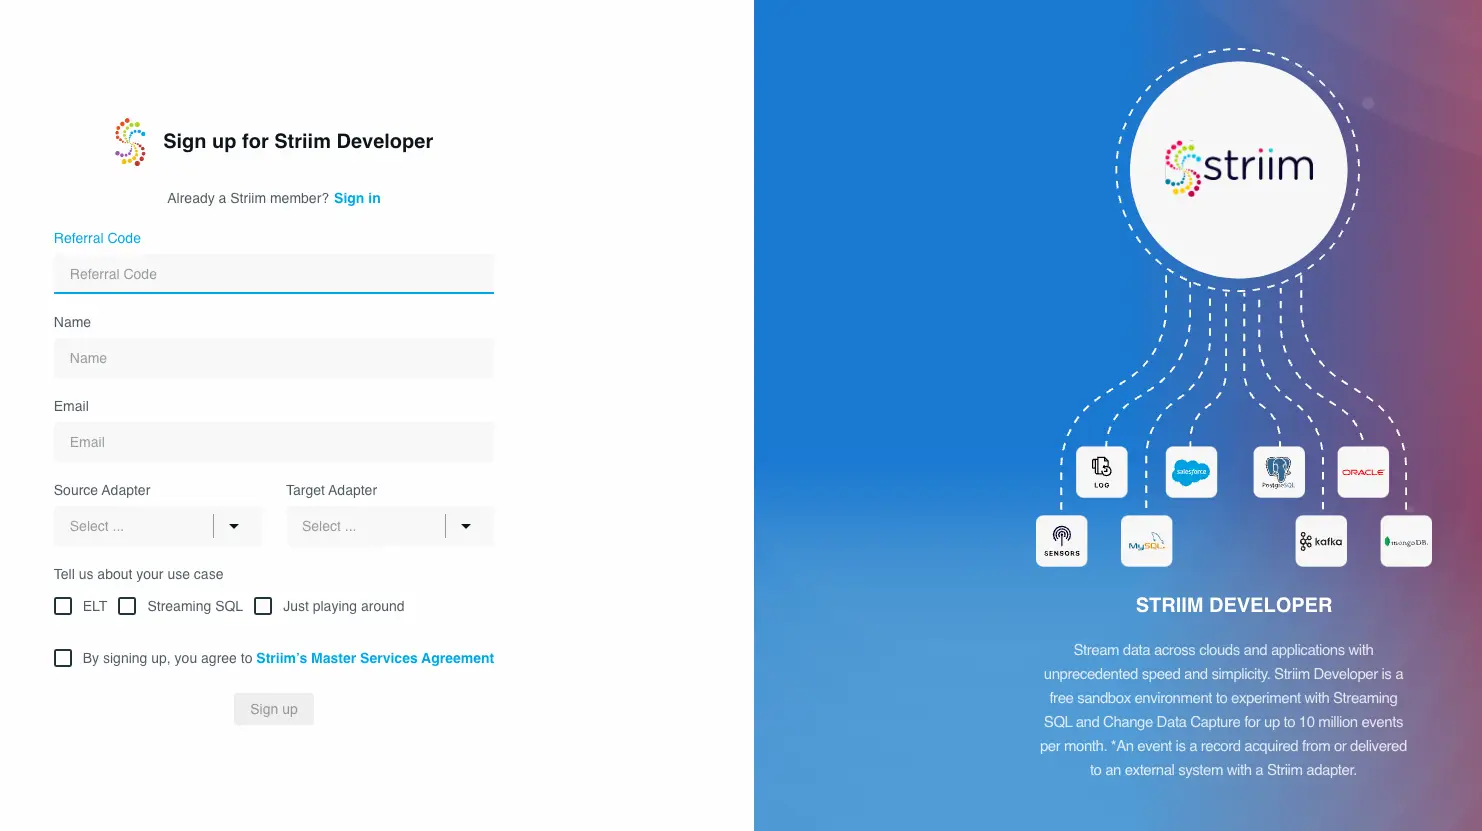
Unlock the true potential of your data with Striim. Don’t miss out—start your 14-day free trial today and experience the future of data integration firsthand. To give what you saw in this recipe a try, get started on your journey with Striim by signing up for free with Striim Developer or Striim Cloud.
Learn more about data streaming using Striim through our other Tutorials and Recipes.