Katherine Rincon

19 Posts

Real-Time Database CDC to Cloudera


As Cloudera increasingly invests in its Enterprise Data Cloud, the ability move data via change data capture or CDC to Cloudera has never been more important. Database CDC to Cloudera helps Cloudera users gain more operational value from their analytics solutions by loading critical database transactions in real time.CDC to Cloudera

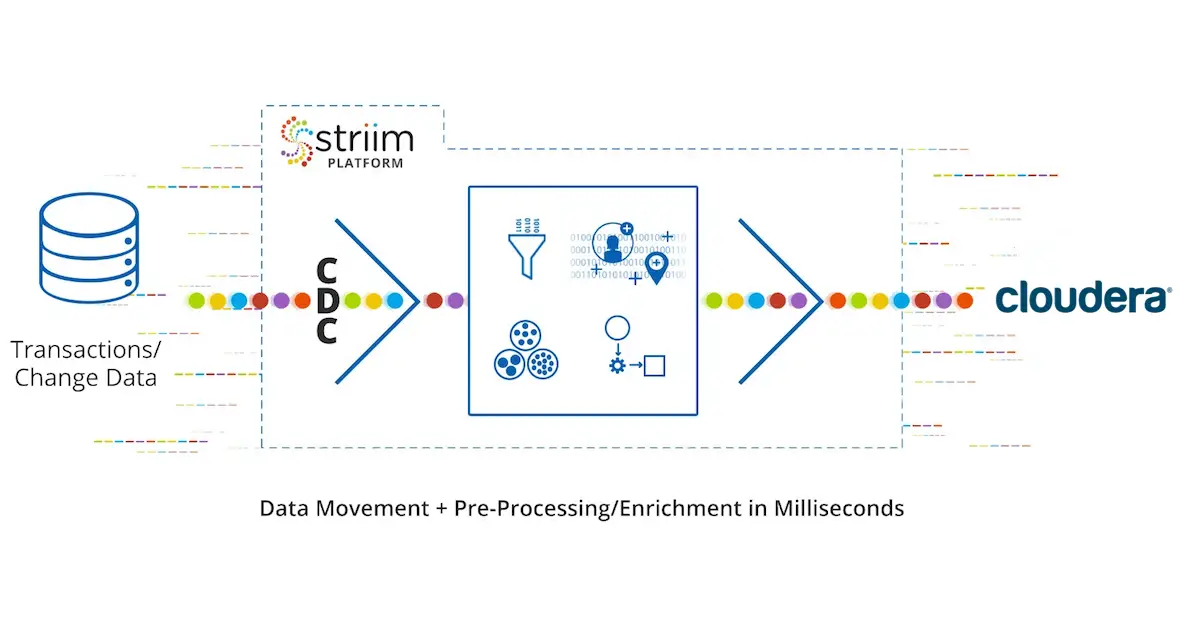
The timely ingestion of large volumes of data to Cloudera is imperative to realizing the true operational value of the platform. The explosion in the amount of data generated and the variety of data formats residing in traditional relational databases and data warehouses requires an ingestion process that is real-time and scalable.

Traditional methods or batch ETL uploads fall short in today’s business timeframes. Latency renders operational and transactional data obsolete and unable to provide Cloudera solutions with the real-time data required for operational intelligence and reporting. The negative performance impact of batch processing on transactional databases is also a major reason to move only the changed data in a continuous fashion.

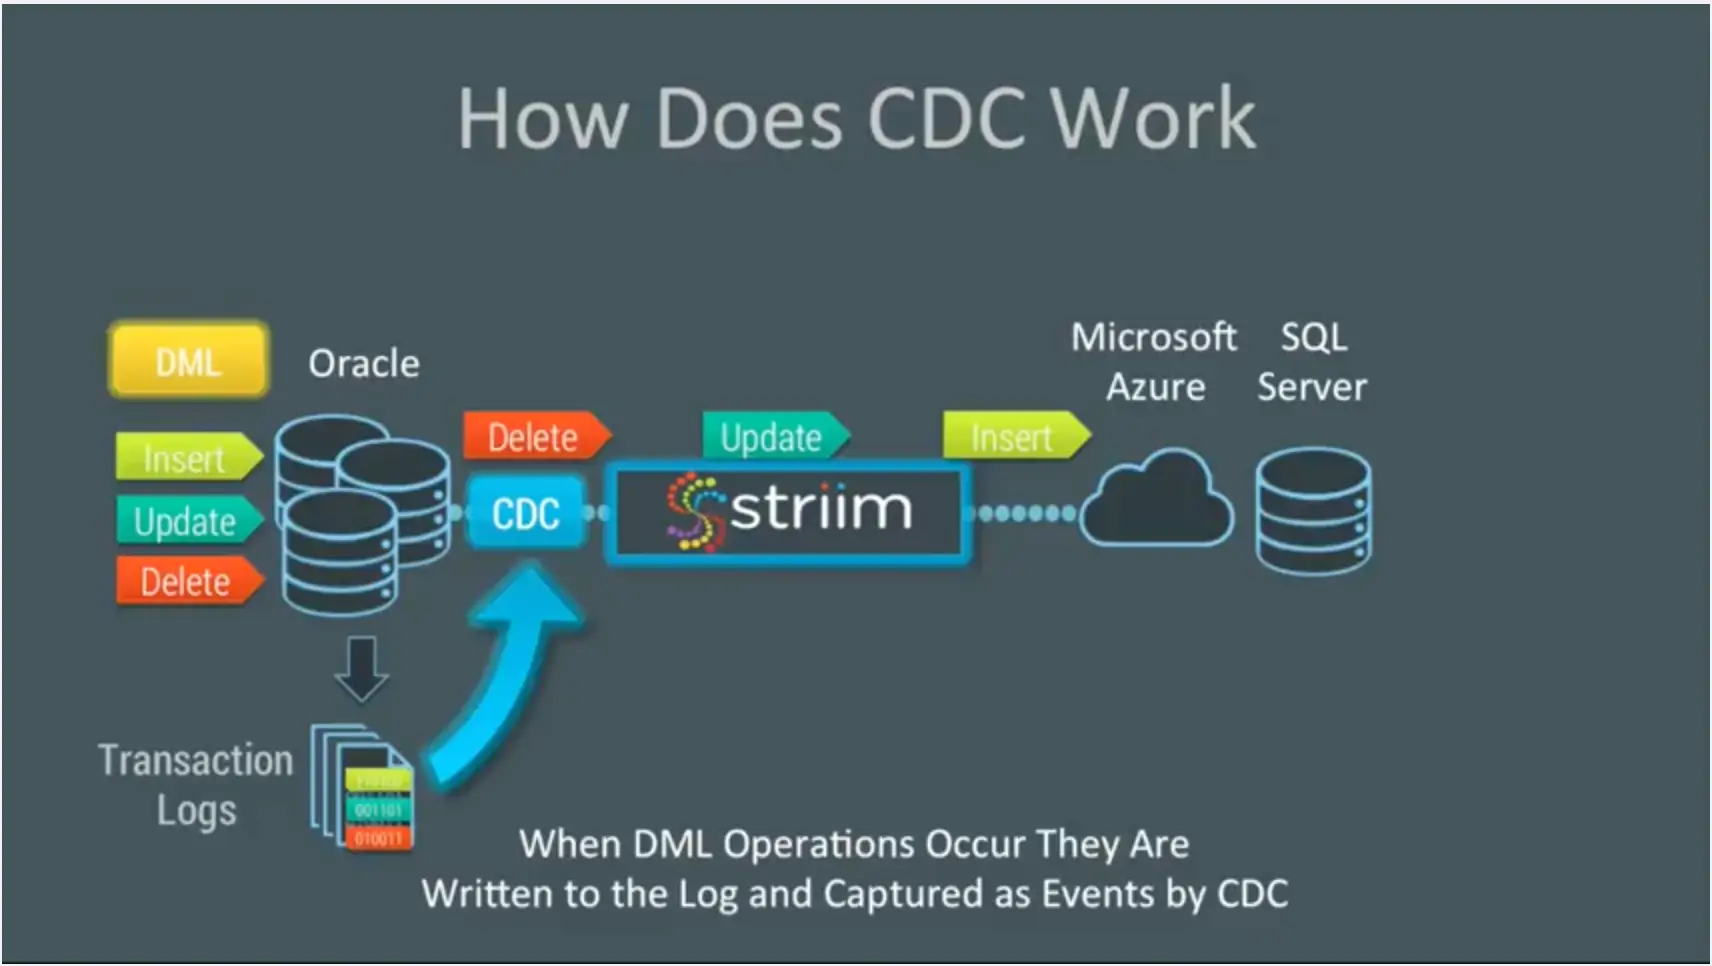
To address the concerns mentioned above, there is a solution to ingest changed data in real time from databases: CDC to Cloudera from Striim. This enterprise-grade streaming data integration solution for Cloudera supports high-volume environments and allows users to move real-time data from a wide variety of sources without impacting source systems.

By moving only change data – continuously and with essential scalability – Cloudera users can rely on the Striim platform for the delivery of data. Data can be loaded as-is, or with a variety of processing, transformations or enrichments applied, all with sub-second latency and in the right format to support specific use cases.

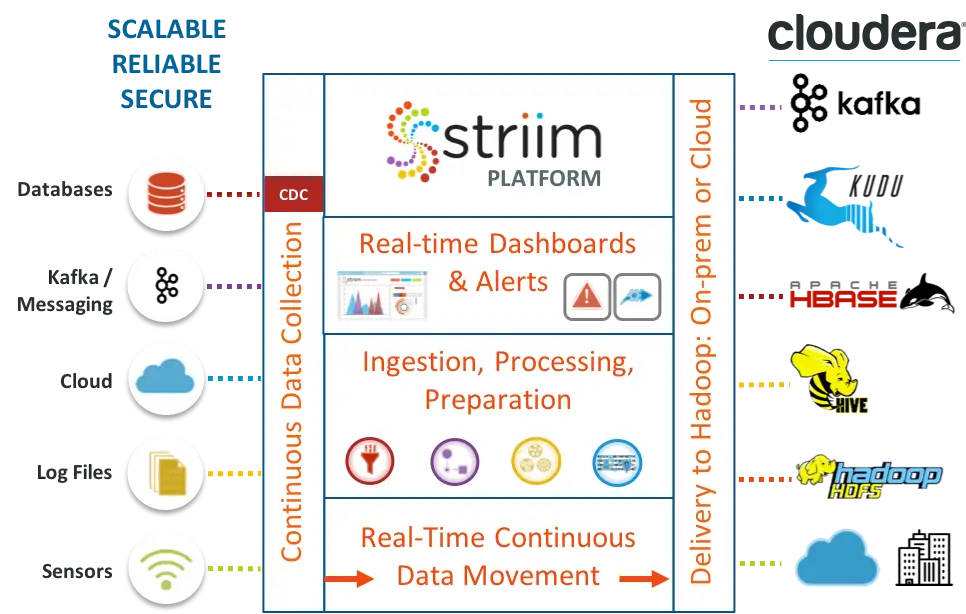
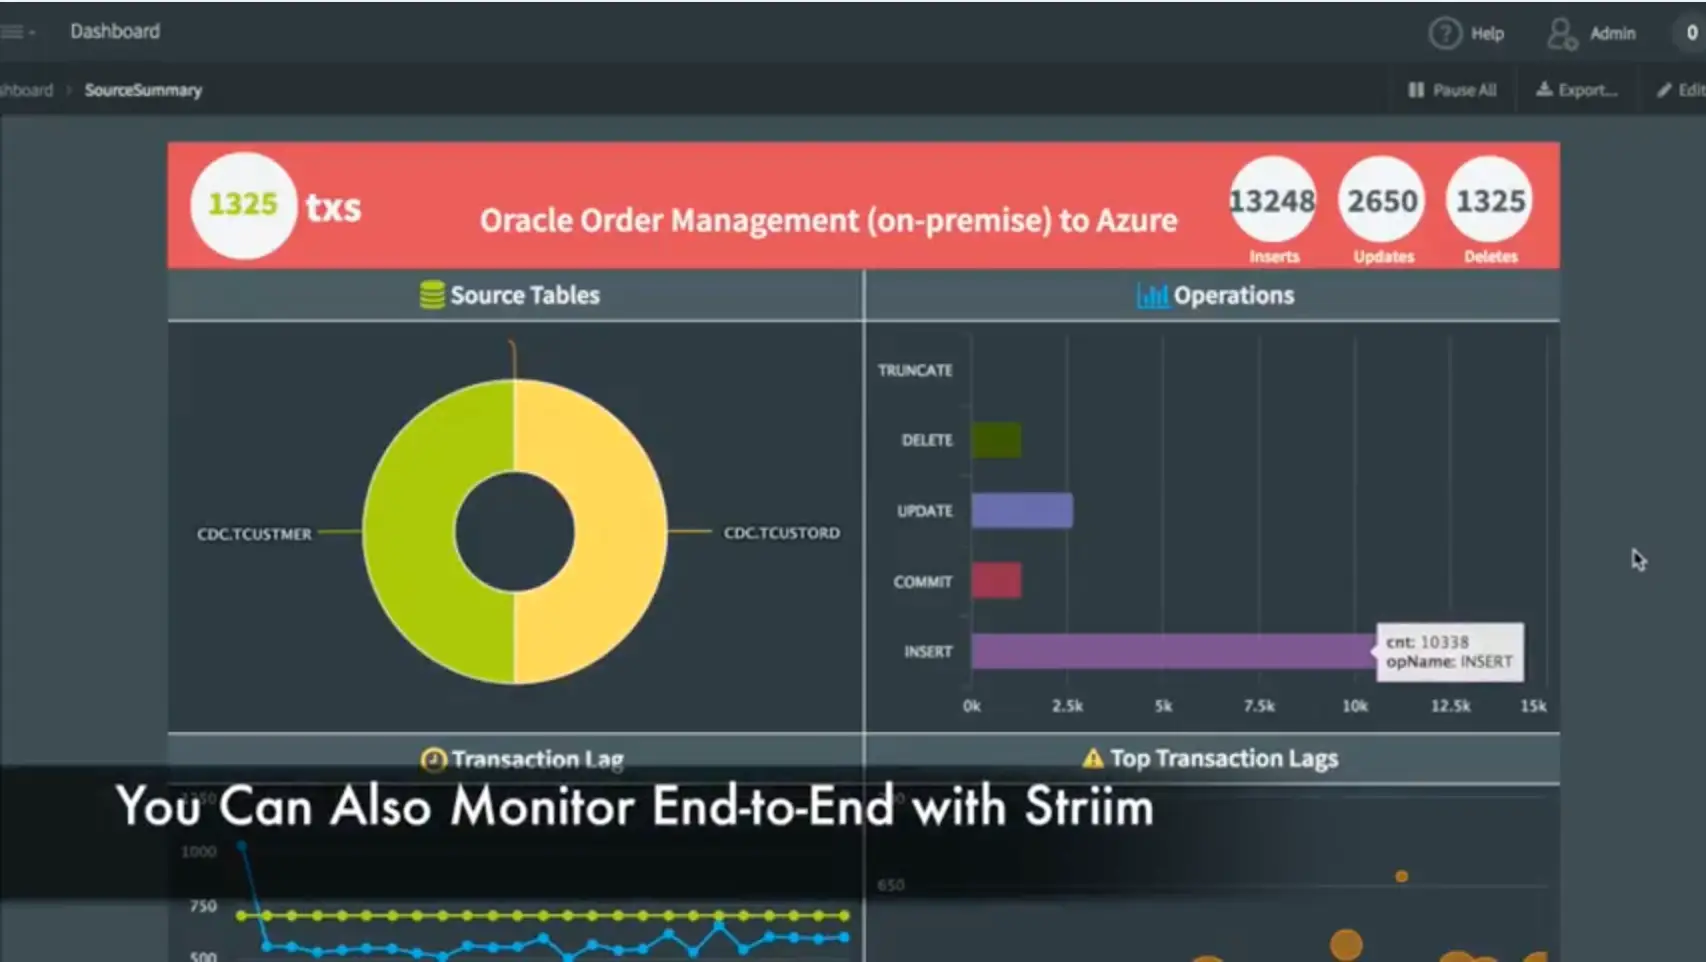
A one-time initial load with continuous change updates ensures up-to-the-second data delivery to Cloudera to support operational decision making. Striim also offers real-time pipeline monitoring with alerting, which is particularly important in the context of mission-critical solutions.

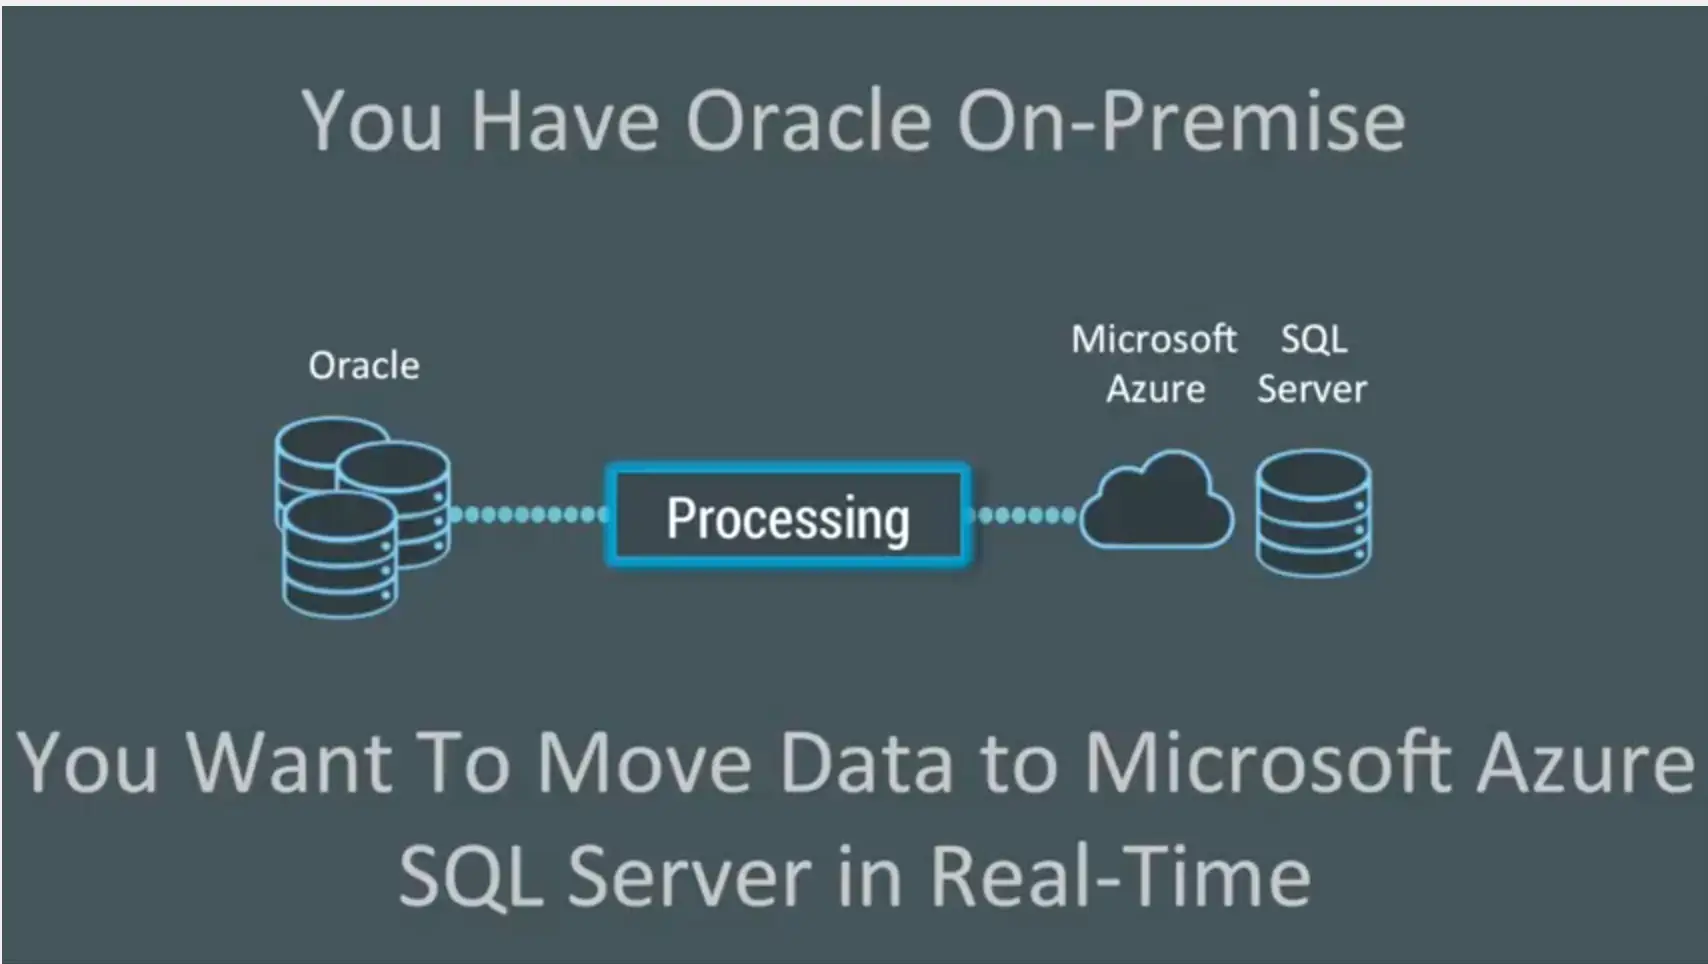
Striim currently offers low-impact, log-based CDC to Cloudera from the following data sources: Oracle, Microsoft SQL Server, MySQL, PostgreSQL, HPE NonStop SQL/MX, HPE NonStop SQL/MP, HPE NonStop Enscribe, MongoDB, and MariaDB. All of these databases can be accessed via Striim’s easy-to-use Wizards and drag-and-drop UI, speeding delivery of CDC to Cloudera solutions. In addition, Striim offers pre-built starter integration applications, such as PostgreSQL CDC to Kafka, that can be leveraged to significantly reduce development efforts of any CDC-based application.

If you’d like a brief walk-through of Striim’s CDC to Cloudera offering, please schedule a demo.

What is iPaaS for Data?

Organizations can leverage a wide variety of cloud-based services today, and one of the fastest growing offerings is integration platform as a service. But what is iPaaS?

There are two major categories of iPaaS solutions available, focusing on application integration and data integration. Application integration works at the API level, typically involves relatively low volumes of messages, and enables multiple SaaS applications to be woven together.What is iPaaS for Data?

Integration platform as a service for data enables organizations to develop, execute, monitor, and govern integration across disparate data sources and targets, both on-premises and in the cloud, with processing and enrichment of the data as its streaming.

Within the scope of iPaaS for data there are older batch offerings, and more modern real-time streaming solutions. The latter are better suited to the on-demand and continuous way organizations are utilizing cloud resources.

Streaming data iPaaS solutions facilitate integration through intuitive UIs, by providing pre-configured connectors, automated operators, wizards and visualization tools to facilitate creation of data pipelines for real-time integration. With the iPaaS model, companies can develop and deploy the integrations they need without having to install or manage additional hardware or middleware, or acquire specific skills related to data integration. This can result in significant cost savings and accelerated deployment.

This is particularly useful as enterprise-scale cloud adoption becomes more prevalent, and organizations are required to integrate on-premises data and cloud data in real time to serve the company’s analytics and operational needs.

Factors such as increasing awareness of the benefits of iPaaS among enterprises – including reduced cost of ownership and operational optimization – are fueling the growth of the market worldwide.

For example, a report by Markets and Markets notes that the Integration Platform as a Service market is estimated to grow from $528 million in 2016 to nearly $3 billion by 2021, at a compound annual growth rate (CAGR) of 42% during the forecast period.

“The iPaaS market is booming as enterprises [embrace] hybrid and multi-cloud strategies to reduce cost and optimize workload performance” across on-premises and cloud infrastructure, the report says. Organizations around the world are adopting iPaaS and considering the deployment model an important enabler for their future, the study says.

Research firm Gartner, Inc. notes that the enterprise iPaaS market is an increasingly attractive space due to the need for users to integrate multi-cloud data and applications, with various on-premises assets. The firm expects the market to continue to achieve high growth rates over the next several years.

By 2021, enterprise iPaaS will be the largest market segment in application middleware, Gartner says, potentially consuming the traditional software delivery model along the way.

“iPaaS is a key building block for creating platforms that disrupt traditional integration markets, due to a faster time-to-value proposition,” Gartner states.

The Striim platform can be deployed on-premises, but is also available as an iPaaS solution on Microsoft Azure, Google Cloud Platform, and Amazon Web Services. This solution can integrate with on-premise data through a secure agent installation. For more information, we invite you to schedule a demo with one of our lead technologists, or download the Striim platform.

Introducing Hazelcast Striim Hot Cache

Today, we are thrilled to announce the availability of Hazelcast Striim Hot Cache. This joint solution with Hazelcast’s in-memory data grid uses Striim’s Change Data Capture to solve the cache consistency problem.

With Hazelcast Striim Hot Cache, you can reduce the latency of propagation of data from your backend database into your Hazelcast cache to milliseconds. Now you have the flexibility to run multiple applications off a single database, keeping Hazelcast cache refreshes up-to-date while adhering to low latency SLAs.


Check out this 5-minute Introduction and Demo of Hazelcast Striim Hot Cache:

https://www.youtube.com/watch?v=B1PYcIQmya4


Imagine that you have an application that works by retrieving and storing information in a database. To get faster response times, you utilize a Hazelcast in-memory cache for rapid access to data.

However, other applications also make database updates which leads to inconsistent data in the cache. When this happens, suddenly the application is showing out-of-date or invalid information.

Hazelcast Striim Hot Cache solves this by using streaming change data capture to synchronize the cache with the database in real time. This ensures that both the cache and associated application always have the most up-to-date data.

Through CDC, Striim is able to recognize which tables and key values have changed. Striim immediately captures these changes with their table and key, and, using the Hazelcast Striim writer, pushes those changes into the cache.

We make it easy to leverage Striim’s change data capture functionality by providing CDC Wizards. These Wizards help you quickly configure the capture of change data from enterprise databases – including Oracle, MS SQL Server, MySQL and HPE NonStop – and propagate that data to a Hazelcast cache.

You can also use Striim to facilitate the initial load of the cache.

To learn more, please read the full press release, visit the Hazelcast Striim Hot Cache product page, or jump right in and download a fully loaded evaluation copy of Striim for Hazelcast Hot Cache.

Real-Time Collection, Enrichment and Analysis of Set-Top Box Data

Competition is stiff. With the onset of Internet protocol TV and “over the top” technology, satellite, telco and cable set-top box providers are scrambling to increase the stickiness of their subscription services. The best way to do this is to provide real-time context marketing for their set-top boxes in order to know the customer’s interests and intentions immediately, and tailor services and offers on-the-fly.

In order to make this happen, these companies need three things:

  • They need to be able to ingest huge volumes of disparate data from a gazillion set-top boxes around the world.
  • They need to be able to – in real time – enrich that data with customer information/behavior and historical trends to assess the customer’s interest in-the-moment.
  • They need to be able to map that enriched data to a set of offers or services while the customer is still present and interested.

The Striim platform helps companies deliver real-time, context marketing applications that addresses all three phases of interaction and analysis. It collects your real-time set top box clickstream data and enriches it with a broad range of contextual data sources such as customer history and past behavior, geolocation, mobile device information, sensors, log files, social media and database transactions.

With Striim’s easy-to-use GUI and SQL-like language, users can rapidly create tailored enterprise-scale, context-driven marketing applications.

The aggregation of real-time and historical information via the set-top box makes it possible for providers to know who is watching right now, where they are, and what their purchasing patterns look like. With this context, providers can instantly deliver the most relevant and effective advertising or offer while the customer is still “present,” giving the provider the best change of motivating the customer to take immediate action.

With the Striim platform, users can deliver a streaming analytics application that constantly integrates real-time actions and location with historical data and trends. Once the customers intentions are identified, they can easily take action to either promote retention or incentivize additional purchases.

Detecting behavior that would be out-of-the-norm may signal a completely new set of advertising opportunities. For example, if a working Mom is at home watching the Disney Channel, it might indicate she is home with a sick child. With streaming analytics and context marketing, this scenario would be detected immediately, and could trigger a set of ads within the customer’s video stream that provide offers for children’s cold and flu medicine.

+ READ MORE

Real-World Examples of Real-Time Log File Monitoring


At its most basic, the goal of log file monitoring is finding things which otherwise would have been missed, such as trends, anomalies, changes, risks, and opportunities. For some firms, log files exist to meet compliance requirements or because software already in use generates them automatically. But for others, analyzing log files – even in real time, as they are created – is incredibly valuable.

In many industries, the speed with which analysis is performed is immaterial. For a personnel-heavy division, for example, looking at employee logs weekly or monthly might provide enough information.

For others, though, the difference between detecting an upsell opportunity while a customer is still on their website, compared to 30 seconds later, could make a difference in what’s purchased. For a smaller subset of applications, real-time monitoring can make the difference between catastrophic failures which could cost millions, and routine maintenance solving the problem.

In general, fields where the mean time to recover from failure is high, and cost of downtime expensive, real-time log file monitoring can prevent costly mistakes and open up otherwise missed opportunities.

Let’s look at two fields that are rapidly adopting real-time analytics: manufacturing and financial services.

Banking & Financial Services

Real-time analysis of log files presents three major opportunities to financial services firms.

First, it allows them the opportunity to make trades faster. Real-time log file monitoring can find network issues and unwanted latency, ensuring that trades are committed when they’re ordered – not later, when the opportunity for arbitrage is entirely passed.

Second, real-time analysis of customer interactions (with ATMs, electronic banking, or even service representatives) provides the opportunity to increase customer satisfaction and even upsell opportunities by noticing trends in behavior as they happen.

Third, real-time analysis of log files is a tremendous boon to security. In a world reliant on technology to support delicate financial systems, real-time analysis may catch network intruders before they can commit crimes. Legacy analysis would find only traces and lost money.

Manufacturing

For manufacturers, especially heavily automated ones, uptime can be critical. Any time that a factory isn’t running because something has gone wrong, it could be losing money both for the company directly, and for any clients downstream who might rely on it to produce intermediate goods.

In these circumstances, real-time monitoring can alleviate risks. Analyzing logs daily, or even every half-hour, wouldn’t notice a machine malfunctioning until potentially too late. On the other hand, real-time analysis can detect failure before it spreads from one machine into the next part of an assembly line.

Real-time analysis can also provide opportunities for manufacturers to streamline operations. In cases where factory equipment is heavily specialized, for example, repair parts can take days or weeks to arrive, all of which is downtime.

Weekly log analysis likely wouldn’t detect parts beginning to wear down until it’s too late. Real-time analysis, on the other hand, allows factory operators to purchase replacement parts preemptively, thereby minimizing or eliminating downtime.

Additionally, real-time log file monitoring in the manufacturing sector can allow companies to keep smaller quantities of inventory or intermediate products on hand. This can help to lower costs and streamline operations.

Ultimately, not every company or business unit will gain tremendous value from real-time analysis. Most, however, will find far more value in under-utilized log files than they expect.

As costs come down and real-time analysis proliferates, it would be prudent for companies to make sure they’re ahead of the curve, or at least tracking it as it evolves.

5 Uses for Real-Time Visualization


The key factor that makes real-time visualization preferable to batch or event-driven visualization is the requirement for immediacy of decision making, which tends to be role-based. A C-suite officer, for example, is unlikely to look at one visual representation of any data and change the strategy their company is taking.Real-time visualization for financial services security, fraud

Conversely, real-time visualization can be tremendously helpful to individuals who must make tactical or operational decisions on the fly.

But before looking at specific uses for real-time data visualization, let’s consider what kinds of use cases most benefit from visualizingin real time. They can generally be broken down into two categories:

  1. Those which allow individuals or firms to better deal with risk, both managing it and responding when something goes wrong
  2. Those which allow them to exploit rapidly emerging opportunities before they disappear

These circumstances, where action must be taken quickly, are where real-time visualizations shine in providing additional context for decision makers.

Use Case 1: Crisis Management

Perhaps the greatest value of real-time visualization in handling risk comes from informing decision makers who need to respond to emergent events. If a storm is on track to destroy a data center, retail outlet, or any part of a firm’s infrastructure or supply chain, for example, real-time visualization can be tremendously helpful.

Descriptive analytics delivered periodically do little for a decision maker concerned with getting customer services up immediately – by the time any analysis is available, the situation is likely to have changed.

Conversely, real-time visualization of assets in a variety of geographic locations allows decision makers to allocate resources where they’re needed most, which can be the difference between keeping and losing customers in industries where uptime is critical.

Use Case 2: Security and Fraud Prevention

In addition to giving firms options for responding to risky situations, real-time visualizations provide tremendous opportunity for reducing risk in day-to-day operations. The ability to centralize and visualize the output from all the sensors a firm has (for example, security cameras, burglar alarms, RFID tags on valuable assets, etc.) allows a single person to monitor billions of dollars’ worth of globally distributed property from one place.

This also makes it easier to find individuals who are attempting to defraud or otherwise steal from a firm before they’ve gotten away with it, because real-time visualizations can alert managers and decision makers to suspicious behavior before fraud actually occurs.

Use Case 3: Resource Management

This use case sits between risk and opportunity, and represents a unique chance for firms to maximize the value they get from existing resources.

Real-time visualization can aide managers in discovering inefficiencies and correct them long before legacy analysis would have signaled an anomaly. If, for example, a service vehicle goes out of commission midday, real-time visualization allows regional managers to react more efficiently and make better decisions with all the available information in front of them.

Use Case 4: Sales

Real-time data visualization opens up great opportunities for firms attempting to make more sales, both in brick-and-mortar institutions and in ecommerce.

Real-time analytics give firms the option to provide customers with contextual suggestions – for example, a supermarket suggesting a recipe using mostly ingredients already in a customer’s cart.

Combine this with more efficient inventory management (restocking hot items more quickly when they sell out), and real-time visualization gives firms a tremendous amount of flexibility to get more products out to consumers.

Use Case 5: Purchasing Decisions

For firms heavily reliant on the purchasing of commodities for their operations, the ability to visualize market trends in real time provides a great deal of added value. It means utilities can buy oil at its cheapest point, and international firms can capitalize on changes in foreign exchange markets rapidly.

Batch or event-driven visualization could have firms buying hours after prices hit their low, whereas real-time processing will alert firms to cheap inputs, resulting in huge cost savings.

Ultimately, firms across a wide variety of markets would do well to consider real-time visualization technology. Perhaps it won’t change their strategic direction, but operational optimizations have the potential to save real money.

Demo: Migrate Oracle Data to Azure in Real Time

Overview

We’d like to demonstrate how you can migrate Oracle data to Microsoft Azure SQL Server running in the cloud, in real time, using Striim and change data capture (CDC).

People often have data in lots of Oracle tables, on-premise. They want to migrate Oracle data into Microsoft Azure SQL Server, in real-time. How do you go about moving data from Oracle to Azure without affecting your production databases?

https://www.youtube.com/watch?v=iglW9aJCUlE

You can’t use SQL queries because typically these would be queries against a timestamp – like table scans that you do over and over again – and that puts a load on the Oracle Database. You might also skip important transactions. You need change data capture (CDC) which enables non-intrusive collection of streaming database change.
Migrate Oracle Data to Azure in Real Time

Striim provides change data capture as a collector out of the box. This enables real-time collection of change data from Oracle SQL Server and MySQL. CDC works because databases write all the operations that occur into transaction logs. Change data capture listens to those transaction marks, instead of using triggers or timestamps, and directly reads these logs to collect operations. This means that every DML operation – every insert, update, and delete – is written to the logs captured by change data capture and turned into events by our platform.

Migrate Oracle Data to Azure in Real Time

In this demo, you will see how you can utilize Striim to do real-time collection of change data capture from Oracle Database and deliver that data, in real-time, into Microsoft Azure SQL Server. We also build a custom monitoring solution of the whole end-to-end data flow. The demo starts at the 1:43 mark.

Connect to Microsoft Azure SQL Server

First, we connect to Microsoft Azure SQL Server. In this instance, we have two tables: TCUSTOMER and TCUSTORD, that we can show are currently completely empty. We use a data flow that we’ve built in Striim to capture data from an on-premise Oracle database using change data capture. You can see the configuration properties, and deliver the data (after doing some processing) into Microsoft Azure SQL Server.

To show this, we run some SQL against Oracle. This SQL does a combination of inserts, updates, and deletes against our two Oracle tables. When we run this, you can see the data immediately in the initial stream. That data stream is then split into multiple processing steps and then delivered into a Azure SQL Server. If we redo the query against our Azure tables, you can see that the previously empty tables now have data in them. That data was delivered live and will continue to be delivered in a streaming fashion as long as changes are happening in the Oracle database.

In addition to the data movement, we’ve also built a monitoring application complete with dashboard that shows data flowing through the various tables, the types of operations occurring, and the entire end-to-end transaction lag. This shows the difference between when a transaction was committed on the source system, and when it was captured and applied to the target. You can also see some of the most recent transactions.

Migrate Oracle Data to Azure in Real Time

This monitoring application was built, again, using a data flow within the Striim platform. This data flow uses the original streaming change data from the Oracle Database and then applies some processing in the form of SQL queries to generate statistics. In addition to generating data for the dashboard, you can also use this as rules to generate alerts for thresholds, etc. The dashboard itself is not hard-coded. It’s generated using a dashboard builder which utilizes queries to connect to the back-end. Each visualization is powered by a query against the back-end data. There are lots of visualizations to choose from.

We hope you have enjoyed seeing how to migrate Oracle data into the cloud using Striim via the Oracle to Azure demo. If you would like a more in-depth look at this application, please request a demo with one of our lead technologists.

451 Research on Striim’s Streaming Data Integration, Analytics and Alerting

Striim platform credited by 451 Research for real-time data integration and streaming analytics“…Canny with its design criteria. [Striim’s] technology platform doesn’t only offer streaming data integration, analytics or alerting: it offers all three.” That’s what Jason Stamper concludes about the Striim platform in his recent 451 Research Impact Report. In his 451 Take, he states:

“Since we expect streaming technologies to get a shot in the arm from the emergence of Internet of Things (IoT) use cases, we think Striim has been canny –­­­­­–­integration, analytics or alerting: it offers all three. Equally wisely, the company is incorporating open source tools such as Apache Kafka, Hive and ElasticSearch to save on development costs, and also allow companies to take advantage of existing infrastructure.”

Mr. Stamper points out how the company has rebranded from WebAction to Striim (pronounced “stream”) because the new name better reflects what the company is trying to do: ‘streaming integration and intelligence.’ (The two ‘i’s in Striim stand for integration and intelligence.)

The report proceeds to detail the unique features of Striim’s end-to-end, real-time data integration and intelligence platform. Everything from real-time, high velocity data collection the instant data is born, to real-time enrichment, correlation and analysis on streaming data, to real-time visualizations and alerts.

There are other vendors in the streaming analytics space trying to assemble an end-to-end platform with open source technologies. However, 451 Research agrees that this approach is ultimately time-consuming and costly. It simply takes too many high-priced developers to wire all of the various technologies together, and in the end, there’s no guarantee it will work at an enterprise scale.

Download the complete 451 Research Impact Report.

The Economist on the Cyber-security Dangers from the Internet of Things

Economist_Internet-of-Things_IoT-July-2014-300x222
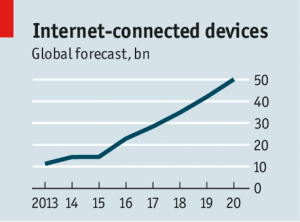
The Internet of Things Means You Now Have Less Time to ID Threats

In a July 12 Cyber-security brief “The internet of things (to be hacked)” The Economist discussed the coming explosion of connected devices sharing data in what has commonly become called the Internet of Things (IoT), or as some are now calling the Internet of Everything (IoE). Either term gets you to a place where 18 months from now you have way too much data coming at you to store it all now to process “later”. “Later” will never come and every one of those devices introduces a new potential security threat to your enterprise. The Economist notes:

“There have already been instances of nefarious types taking control of webcams, televisions and even a fridge, which was roped into a network of computers pumping out e-mail spam.”

In this hyper-connected world you need to be continuously monitoring all of devices and traffic on your networks to note interesting correlated events across your infrastructure. WebAction Security Event Processing Data Driven Apps give you a unique insight across your data streams.

Wireless Networks Will Become Saturated

By the nature of IoT devices, wireless is the preferred method of communication. As the number of devices grows, so does the wireless chatter and noise. The chatter is building over all wireless communication channels: WiFi, cellular, Bluetooth, near field communications (NFC), and others. There is no end in sight to the expected growth of wireless connected devices. Networks will need to be fortified and new methods of managing wireless traffic are being considered. Enriching wireless network traffic with rich context and history allows for dynamic network traffic prioritization based on the profiles of your customers. Always make sure that your most important customers always get the best Quality of Service, and know immediately when quality degrades.

Insights Available in Your IoT Streams

The Economist fears that with the loose regulation of connected devices we will see more incidents of hackers working their way into your refrigerator and thermostat. The brief concludes with: “Who needs a smart fridge anyway?” I suppose that is an interesting question, but rather than resisting progress and change (which we know doesn’t work in the long-run), we suggest finding novel ways to immediately identify and neutralize security threats arising from the Internet of Things.

All of those connect devices are reporting their streams back to home base, and home base needs to make some snappy decisions about what to do with the data streams flowing in. At the same time every  stream rides on your wireless networks and contains potential threats and useful data signatures. That’s where the WebAction Real-time App Platform shines, monitoring streams to identify patterns in-memory enabling immediate (and informed) action downstream. On the fly your real-time data is correlated across streams, filtered, and enriched with history and context to create highly actionable Big Data Records.

The Internet of Things comes with some very significant blue sky ahead of it and the WebAction Real-time App Platform enables you to take advantage of this new frontier. Request a demo of the WebAction Platform.

Back to top